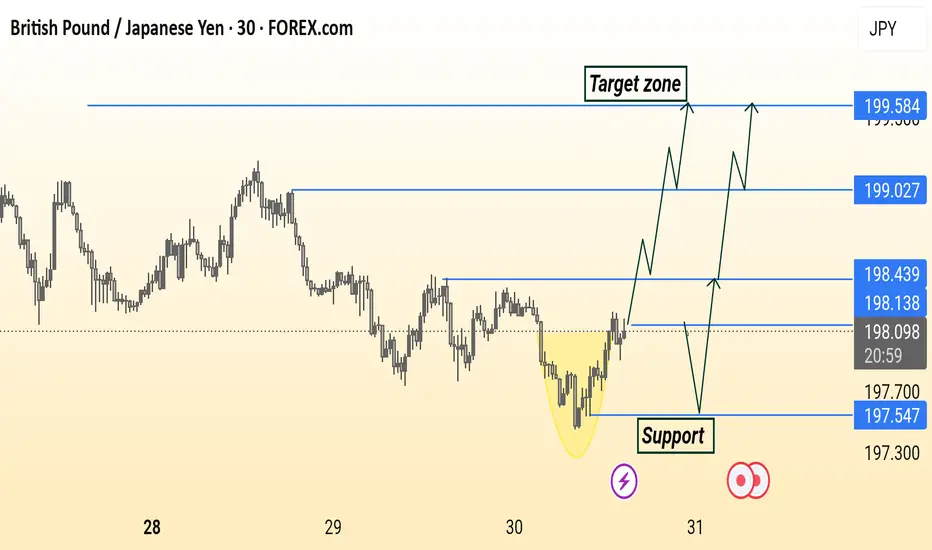
GBP/JPY 30-minute chart shows a potential bullish reversal from a rounded bottom pattern. Price is approaching support around 198.13–197.54, with multiple possible bullish scenarios targeting resistance levels at 198.43, 199.03, and 199.58. The highlighted “Target zone” suggests a continuation if price breaks and holds above key resistance.
t.me/Forex_Gold_Signals117
Gold Free trades ❤️
kill gold every day with confirm signals ❤️
t.me/Forex_Gold_Signals117
Gold Free trades ❤️
kill gold every day with confirm signals ❤️
t.me/Forex_Gold_Signals117
Disclaimer
The information and publications are not meant to be, and do not constitute, financial, investment, trading, or other types of advice or recommendations supplied or endorsed by TradingView. Read more in the Terms of Use.
t.me/Forex_Gold_Signals117
Gold Free trades ❤️
kill gold every day with confirm signals ❤️
t.me/Forex_Gold_Signals117
Gold Free trades ❤️
kill gold every day with confirm signals ❤️
t.me/Forex_Gold_Signals117
Disclaimer
The information and publications are not meant to be, and do not constitute, financial, investment, trading, or other types of advice or recommendations supplied or endorsed by TradingView. Read more in the Terms of Use.