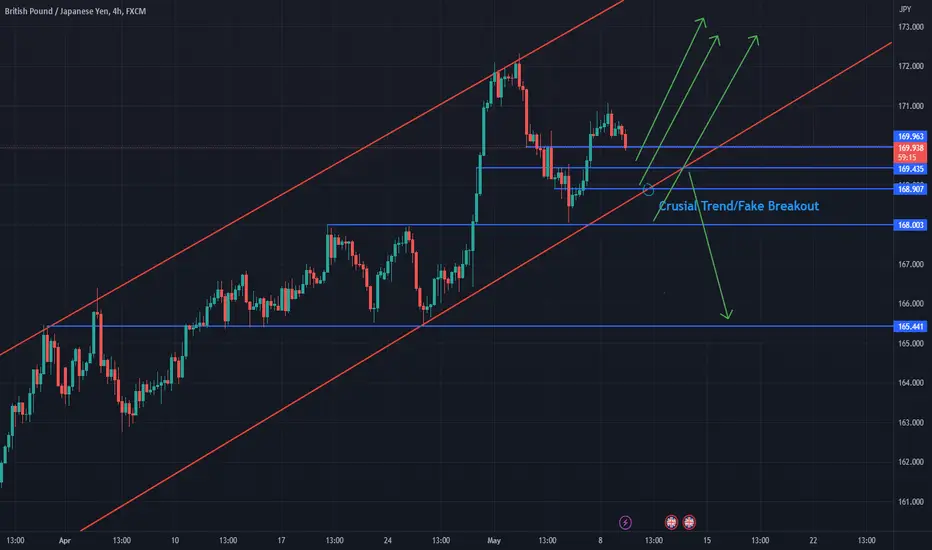
It looks like there will be something interesting if you look at the trendline on the H4 timeframe. If you draw a line from below, it will be seen that a Fake Breakout has occurred. But if it is a breakout then the decline will reach the 165 area, becoming a strong support determining area to return to the positive trend.
Disclaimer
The information and publications are not meant to be, and do not constitute, financial, investment, trading, or other types of advice or recommendations supplied or endorsed by TradingView. Read more in the Terms of Use.
Disclaimer
The information and publications are not meant to be, and do not constitute, financial, investment, trading, or other types of advice or recommendations supplied or endorsed by TradingView. Read more in the Terms of Use.