Chart Analysis Summary:
Timeframe: 1H (1 Hour)
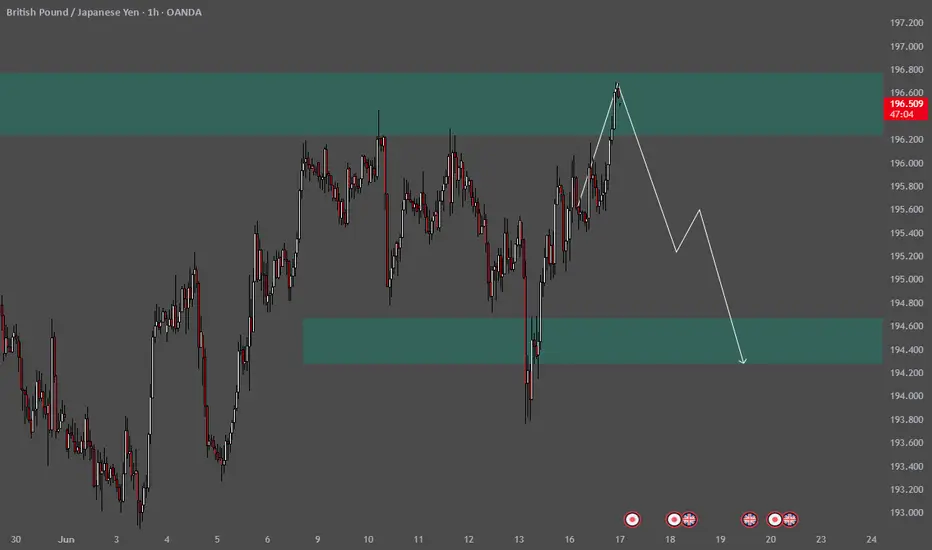
Instrument: GBP/JPY (OANDA broker)
Analysis Type: Price Action / Supply & Demand Zones
🔍 Key Observations:
Supply Zone (Resistance Area):
The top green box (around 196.500 - 196.800) represents a supply zone.
Price is projected to reach this zone before reversing.
This area has historically rejected price, suggesting strong seller presence.
Bearish Projection:
A bearish arrow shows the expectation that price will reverse from the supply zone.
The chartist anticipates a drop after hitting this resistance.
Demand Zone (Support Area):
The bottom green box (around 194.300 - 194.600) marks a demand zone.
It’s the potential target area where price might find support and possibly bounce again.
Market Structure:
The chart indicates a potential lower high formation after price hits resistance.
This structure supports a bearish scenario toward the demand zone.
📉 Trade Idea (Implied):
Sell setup near the 196.600 - 196.800 resistance zone.
Take profit around the 194.400 demand zone.
Risk: Price might break above the supply zone, invalidating the bearish scenario.
Timeframe: 1H (1 Hour)
Instrument: GBP/JPY (OANDA broker)
Analysis Type: Price Action / Supply & Demand Zones
🔍 Key Observations:
Supply Zone (Resistance Area):
The top green box (around 196.500 - 196.800) represents a supply zone.
Price is projected to reach this zone before reversing.
This area has historically rejected price, suggesting strong seller presence.
Bearish Projection:
A bearish arrow shows the expectation that price will reverse from the supply zone.
The chartist anticipates a drop after hitting this resistance.
Demand Zone (Support Area):
The bottom green box (around 194.300 - 194.600) marks a demand zone.
It’s the potential target area where price might find support and possibly bounce again.
Market Structure:
The chart indicates a potential lower high formation after price hits resistance.
This structure supports a bearish scenario toward the demand zone.
📉 Trade Idea (Implied):
Sell setup near the 196.600 - 196.800 resistance zone.
Take profit around the 194.400 demand zone.
Risk: Price might break above the supply zone, invalidating the bearish scenario.
💰 King Maker FX — Master the Gold Market with Precision.
Unlock real-time trends, pro strategies, and expert insights to turn every move into profit. 🚀✨ t.me/kmforexllc
Unlock real-time trends, pro strategies, and expert insights to turn every move into profit. 🚀✨ t.me/kmforexllc
Related publications
Disclaimer
The information and publications are not meant to be, and do not constitute, financial, investment, trading, or other types of advice or recommendations supplied or endorsed by TradingView. Read more in the Terms of Use.