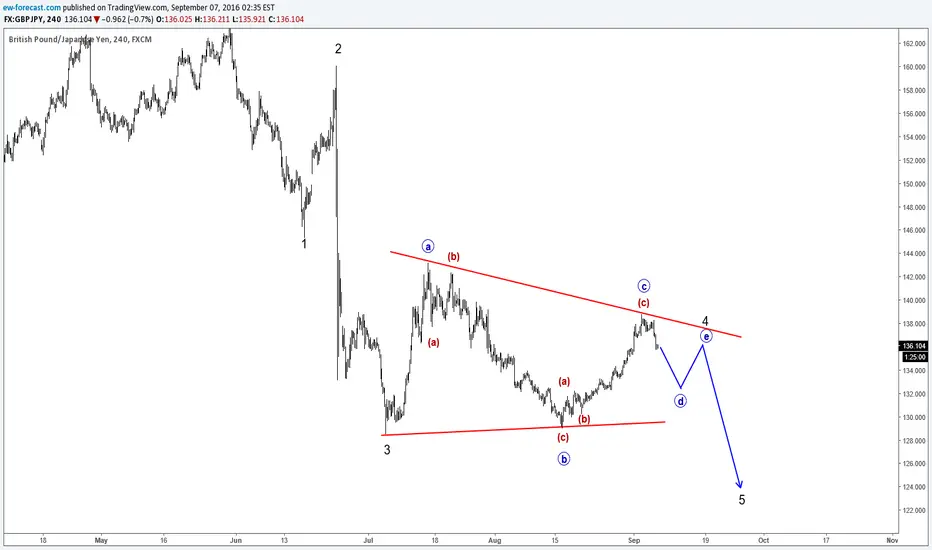
On the 4h chart of GBPJPY we are looking at a triangle correction pattern taking place, that is located in black wave 4 with still two more waves to go, waves d and e for the full completion of the pattern. That said intraday structure suggest that price could be now trading in blue wave d-circled, after recently completing blue wave c around the 139 area.
As we know a triangle correction is a continuation pattern that can after its completion point to lower levels, as in this case.
As we know a triangle correction is a continuation pattern that can after its completion point to lower levels, as in this case.
👉Explore Our Services @ wavetraders.com/elliott-wave-plans/
Learn Elliott Waves
👉 wavetraders.com/academy/
Newsletter Sign up
👉 bit.ly/3FVPVzO
Learn Elliott Waves
👉 wavetraders.com/academy/
Newsletter Sign up
👉 bit.ly/3FVPVzO
Disclaimer
The information and publications are not meant to be, and do not constitute, financial, investment, trading, or other types of advice or recommendations supplied or endorsed by TradingView. Read more in the Terms of Use.