Monthly Chart
- Price respected the Major QP (190.00)
- Price also formed a Triple Bottom
- The previous monthly candle ended as a bullish engulfing
- Short MAs are above Longer MAs and price is above both
- Sentiment - Look for buys
Weekly Chart
- Price found support at he weekly zone and made a bullish push
- Price then sold off (retracement) and respected the 38.2 Fib Level and Minor AQ (192.5) before continuing the bullish trend
- The price of the previous candle met resistance at the trend line & sold off but ultimately closed respecting the Minor QP (195.000).
- This weeks candle found bullish support and closed bullish engulfing
- Sentiment - Look for buys
Daily Chart
Price retraced and found support at the 50.0 Fib Level - confirming bullish trend continuation
Expecting price to continue bullish and test the 0.27 Fib, which also aligns with the Daily Supply Zone & Minor AQ (197.500).
Will look to enter long on lower time frame - 1H/2H
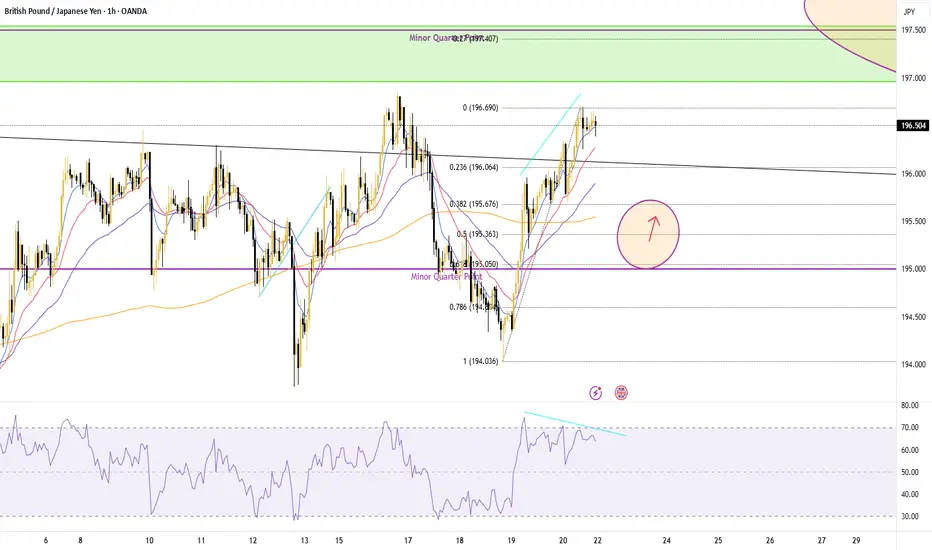
1 Hour Chart
Based on the RSI - a bearish divergence is present signaling some bearish pressure
This algins with the daily TF, as I am looking to enter long after a minor retracement on this timeframe.
Expecting to enter a long position near the 50.0-61.8 Fib area.
Disclaimer
The information and publications are not meant to be, and do not constitute, financial, investment, trading, or other types of advice or recommendations supplied or endorsed by TradingView. Read more in the Terms of Use.
Disclaimer
The information and publications are not meant to be, and do not constitute, financial, investment, trading, or other types of advice or recommendations supplied or endorsed by TradingView. Read more in the Terms of Use.
