SMC trading point update
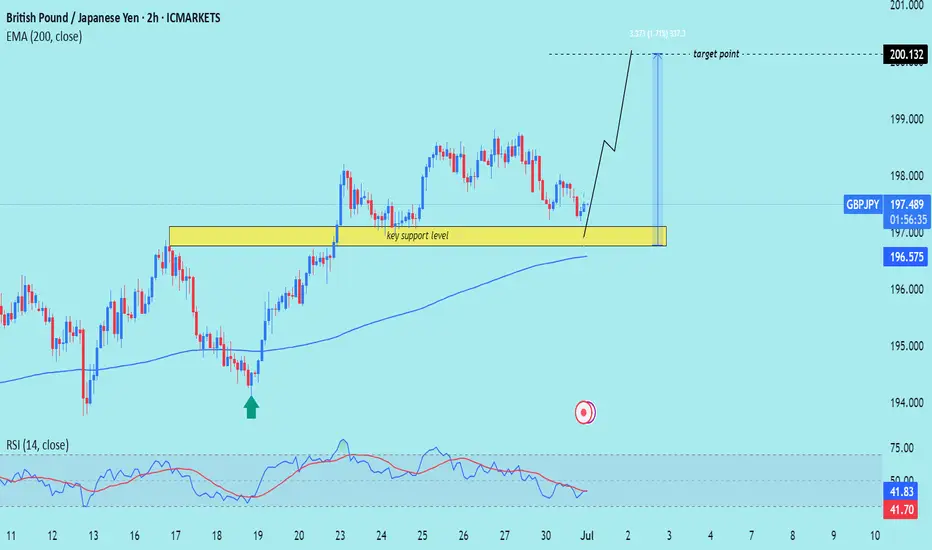
Technical analysis of GBP/JPY on the 2-hour timeframe, signaling a potential rally from a key support area. Here’s a breakdown of this analysis:
---
Technical Breakdown
1. Key Support Zone (Yellow Box):
Price has pulled back to a strong support level around 196.50–197.00.
This level previously acted as resistance and now flipped to support (classic support-resistance flip), marked by the green arrow.
2. EMA 200 as Dynamic Support:
The 200 EMA (~196.567) is just below the support zone, reinforcing the likelihood of a bullish bounce from this area.
3. Bullish Price Projection:
The chart suggests a bounce off this support zone with a projected move toward the target point at 200.132, indicating a +1.71% upside.
4. RSI Indicator (14):
RSI is at 43.47, approaching the oversold region but curving upward — supporting a potential reversal to the upside.
---
Forecasted Move
Expected Move: Bullish reversal from support, targeting 200.132.
The chart outlines a potential entry at current levels, with a bounce confirmed by price respecting the yellow support zone.
Mr SMC Trading point
---
Trading Idea Summary
Bias: Bullish
Entry Zone: Around 196.50–197.00
Stop-Loss: Below support zone (~196.00 or lower)
Take-Profit: 200.132
Confirmation: Bullish candlestick pattern or RSI crossover
plesse support boost 🚀 this analysis
Trade closed: stop reached
(Services:✔️ JOIN Telegram channel
#Gold trading ★Analysis★ 📊
Gold trading signals 🚀 99%
t.me/SmcTradingPoin
Join my recommended broker , link 👇
World best broker exness ✅D
one.exnesstrack.org/a/l1t1rf3p6v
#Gold trading ★Analysis★ 📊
Gold trading signals 🚀 99%
t.me/SmcTradingPoin
Join my recommended broker , link 👇
World best broker exness ✅D
one.exnesstrack.org/a/l1t1rf3p6v
Disclaimer
The information and publications are not meant to be, and do not constitute, financial, investment, trading, or other types of advice or recommendations supplied or endorsed by TradingView. Read more in the Terms of Use.