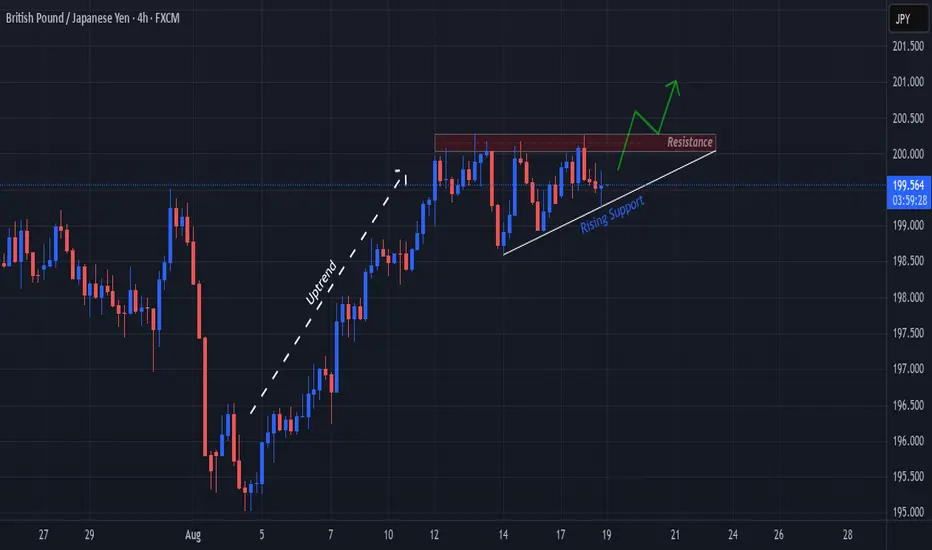
An Ascending Triangle is typically considered a Bullish Continuation Pattern when Price is in an uptrend prior to falling into the Pattern.
Currently Price is being held below the Horizontal Resistance Zone @ 200 - 200.3
Once Price is able to Break Above Resistance, this could deliver Long Opportunities as a Breakout and Retest Set-Up of the Ascending Triangle!
**Beware of potential False Breakout or a Breakout in the Bearish direction!
Note
Its worth noting that CPI y/y will be coming out for GBP Wednesday, 8/20/25, with a forecast of a .1% increase being a bullish outlook! This could strengthen the Bullish bias.For All Things Currency,
Keep It Current,
With Novi Fibonacci!
Keep It Current,
With Novi Fibonacci!
Related publications
Disclaimer
The information and publications are not meant to be, and do not constitute, financial, investment, trading, or other types of advice or recommendations supplied or endorsed by TradingView. Read more in the Terms of Use.
For All Things Currency,
Keep It Current,
With Novi Fibonacci!
Keep It Current,
With Novi Fibonacci!
Related publications
Disclaimer
The information and publications are not meant to be, and do not constitute, financial, investment, trading, or other types of advice or recommendations supplied or endorsed by TradingView. Read more in the Terms of Use.
