🔹 Pair / TF | GBP/JPY, 1 h → 15 m |
| 🔹 Bias | Bearish (selling the break of support) |
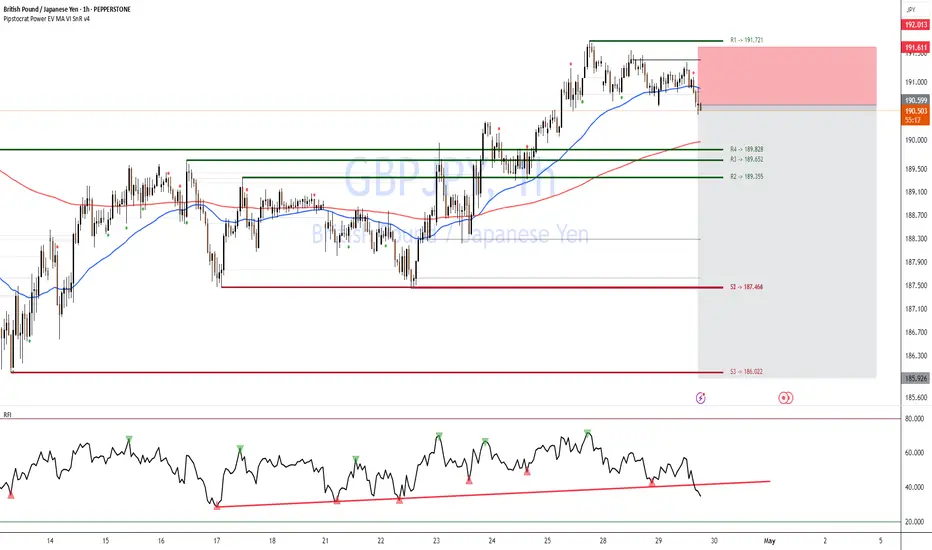
1. 📊 Key Levels
Level Price Role
R1 191.721 Major resistance (green)
Broken Support 190.65 (black line) Minor support → now resistance
R4 189.828 Next minor support
R2 189.355 Next major support
2. 🚨 Trigger
Price closes below the 190.65 support (black line) on 1 h, AND
200-hour MA (red) has just been rejected—sellers stepping in.
This decisive break flips 190.65 into new resistance.
3. ✅ Confirmation
RFI oscillator on 15 m dips below its rising trendline and fails to reclaim it.
Momentum is clearly bearish—no divergence or oversold reversal signal.
4. 🎯 Entry & Stops
| 🔶 Entry Zone | 0.19060–0.19050 (just below 190.65) | | 🔴 Stop-Loss | 0.19180 (above R1 at 191.72) ≈ 120 pips |
Place a Sell-Stop at 0.19055 (mid-zone).
Risk: 1–2% of account on ~120-pip SL.
5. 🎯 Profit Targets
Target Level Pips RRR
T1 R4 189.828 ~82 pips 1 : 0.7
T2 R2 189.355 ~125 pips 1 : 1
Scale out:
Exit ½ at T1.
Let the rest run to T2.
6. ⚙️ Trade Management
Move SL to breakeven once +40 pips in profit.
Monitor RFI on 15 m:
If RFI spikes above its trendline before T1, close remaining.
Adjust if you see large wicks or volume spikes into support zones.
7. 🔑 Rationale
Support→Resistance flip at 190.65 gives a logical entry & SL.
200-hour MA rejection confirms sellers overpowering buyers.
RFI confirms sustained bearish momentum.
High RRR (>1 : 1) ensures edge even with a moderate win-rate.
⚡ Highlight:
This is a bank-order-flow style fade—selling the break of minor support after a MA confluence test, riding momentum into larger support zones.
| 🔹 Bias | Bearish (selling the break of support) |
1. 📊 Key Levels
Level Price Role
R1 191.721 Major resistance (green)
Broken Support 190.65 (black line) Minor support → now resistance
R4 189.828 Next minor support
R2 189.355 Next major support
2. 🚨 Trigger
Price closes below the 190.65 support (black line) on 1 h, AND
200-hour MA (red) has just been rejected—sellers stepping in.
This decisive break flips 190.65 into new resistance.
3. ✅ Confirmation
RFI oscillator on 15 m dips below its rising trendline and fails to reclaim it.
Momentum is clearly bearish—no divergence or oversold reversal signal.
4. 🎯 Entry & Stops
| 🔶 Entry Zone | 0.19060–0.19050 (just below 190.65) | | 🔴 Stop-Loss | 0.19180 (above R1 at 191.72) ≈ 120 pips |
Place a Sell-Stop at 0.19055 (mid-zone).
Risk: 1–2% of account on ~120-pip SL.
5. 🎯 Profit Targets
Target Level Pips RRR
T1 R4 189.828 ~82 pips 1 : 0.7
T2 R2 189.355 ~125 pips 1 : 1
Scale out:
Exit ½ at T1.
Let the rest run to T2.
6. ⚙️ Trade Management
Move SL to breakeven once +40 pips in profit.
Monitor RFI on 15 m:
If RFI spikes above its trendline before T1, close remaining.
Adjust if you see large wicks or volume spikes into support zones.
7. 🔑 Rationale
Support→Resistance flip at 190.65 gives a logical entry & SL.
200-hour MA rejection confirms sellers overpowering buyers.
RFI confirms sustained bearish momentum.
High RRR (>1 : 1) ensures edge even with a moderate win-rate.
⚡ Highlight:
This is a bank-order-flow style fade—selling the break of minor support after a MA confluence test, riding momentum into larger support zones.
Disclaimer
The information and publications are not meant to be, and do not constitute, financial, investment, trading, or other types of advice or recommendations supplied or endorsed by TradingView. Read more in the Terms of Use.
Disclaimer
The information and publications are not meant to be, and do not constitute, financial, investment, trading, or other types of advice or recommendations supplied or endorsed by TradingView. Read more in the Terms of Use.