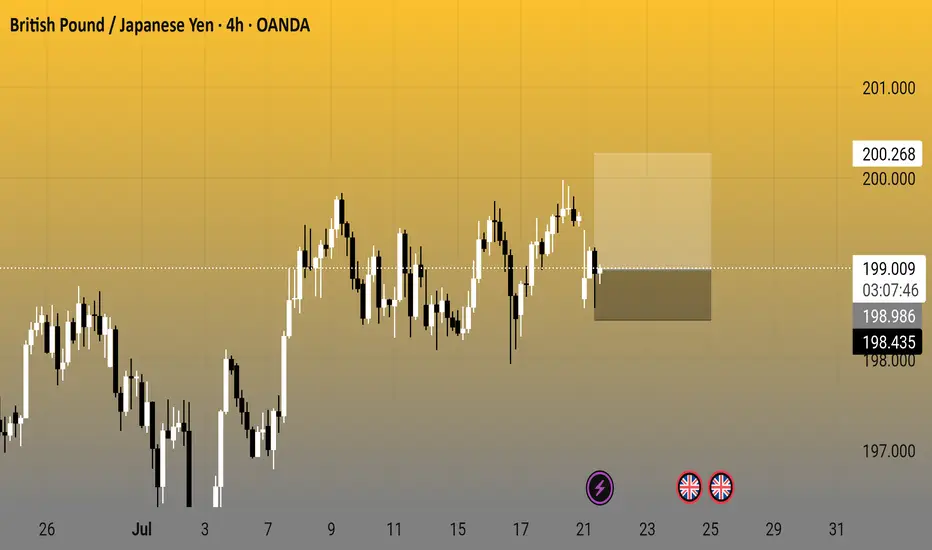
4-hour candlestick chart from OANDA shows the GBP/JPY currency pair's price movement, currently at 199.038 with a decrease of 0.542 (-0.27%). The chart highlights a recent consolidation phase around the 199-200 range, with key levels marked at 201.000, 200.268, 199.038, 198.986, and 198.435. The data reflects trading activity as of 03:08:55.
Daily XAU/USD FREE setups | Let's grow together!
| XAU/USD Trader | Telegram: https://t.me/Aleegoldsignals
| XAU/USD Trader | Telegram: https://t.me/Aleegoldsignals
Disclaimer
The information and publications are not meant to be, and do not constitute, financial, investment, trading, or other types of advice or recommendations supplied or endorsed by TradingView. Read more in the Terms of Use.