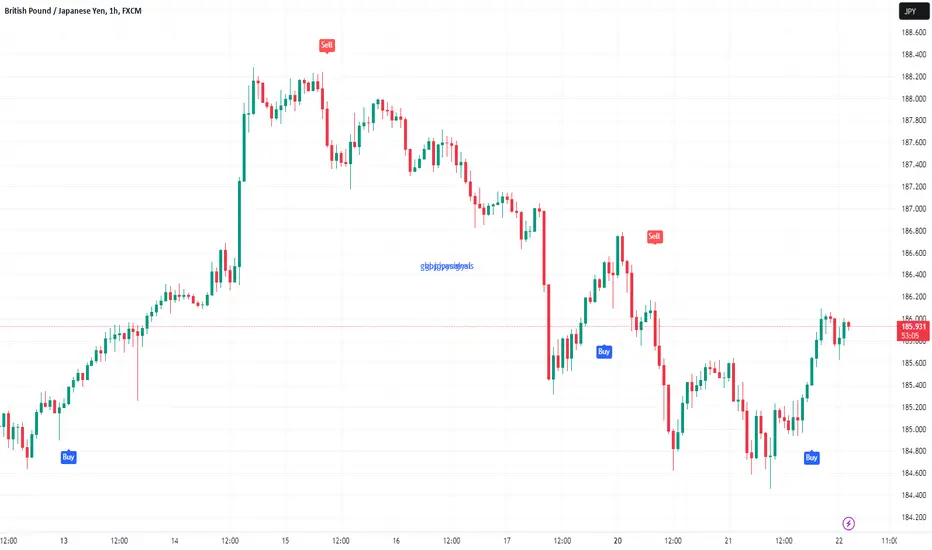
The GBP/JPY daily chart portrays the pair as neutral biased, as the slope of the Tenkan and Kijun-Sen shifted flat, which could open the door for range-bound trading. On the upside, the pair’s first resistance would be the Tenkan-Sen at 186.37, followed by the 187.00 figure, ahead of the year-to-date (YTD) high at 188.24.
On the other hand, if GBP/JPY drops below the Kijun-Sen at 184.52, that would pave the way to test the Senkou Span B at 183.15, followed by the bottom of the Ichimoku Cloud (Kumo) at 181.75.
🟢Free Signals:
t.me/forextradingfusion
🔴Contact:
t.me/tradingconmike1
t.me/forextradingfusion
🔴Contact:
t.me/tradingconmike1
Disclaimer
The information and publications are not meant to be, and do not constitute, financial, investment, trading, or other types of advice or recommendations supplied or endorsed by TradingView. Read more in the Terms of Use.
