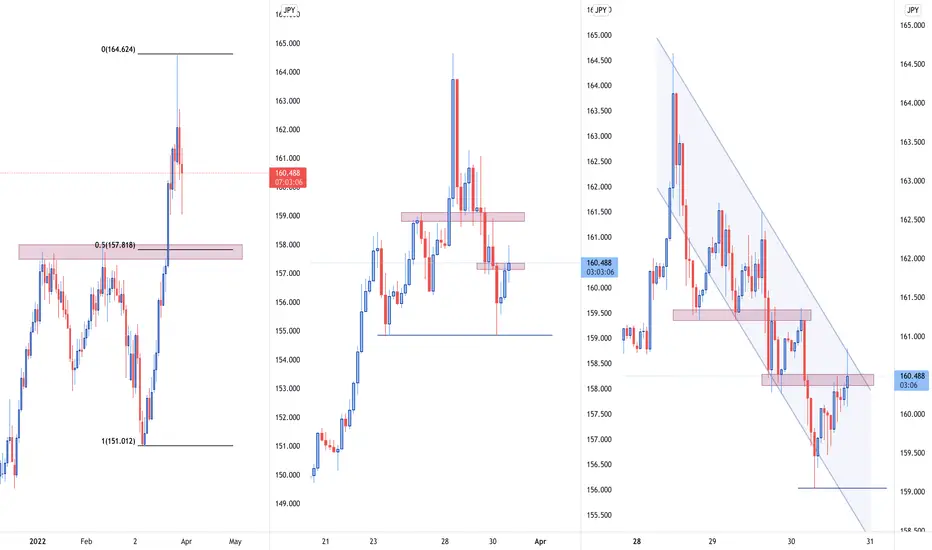
Taking a look at the DAILY timeframe chart, it can be inferred that the price is currently in the process of completion of the correctional move. Narrowing down to the H4 timeframe chart, it can be observed that the price is trading at the level of previous support later turned resistance. Going even further and zooming into the hourly timeframe chart, we can see that a downtrending channel has been formed and the price has been able to spike above the area of the upper boundary to gain some liquidity. We are now patiently waiting for the price to keep dropping and we have set the area of 159.0 as our initial target.
Disclaimer
The information and publications are not meant to be, and do not constitute, financial, investment, trading, or other types of advice or recommendations supplied or endorsed by TradingView. Read more in the Terms of Use.
Disclaimer
The information and publications are not meant to be, and do not constitute, financial, investment, trading, or other types of advice or recommendations supplied or endorsed by TradingView. Read more in the Terms of Use.