GBP/JPY Rejection from Resistance Zone 🧱📌 | Bearish Setup In Play 🔻💹
📌 Technical Analysis Overview:
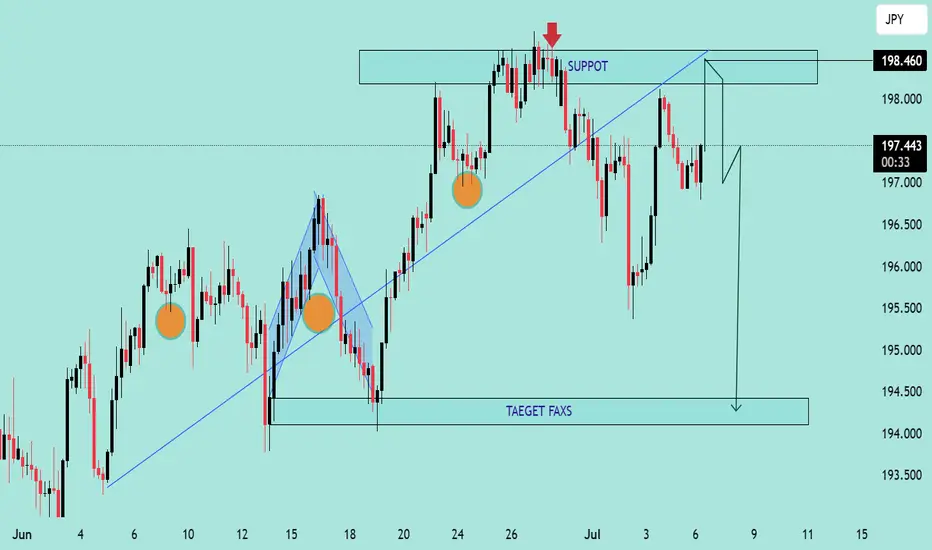
The chart illustrates a clear rejection from the resistance zone around 198.460, where previous price action formed a double-top pattern (🔴 red arrow). This suggests a strong supply area with selling pressure building.
🔍 Key Observations:
📏 Trendline Break:
The upward trendline (blue) has been decisively broken.
This break signals a loss of bullish momentum.
🧱 Resistance Zone @ 198.000–198.460:
Price tested this zone multiple times but failed to break above.
Acts now as a strong resistance zone.
🟠 Support Turned Resistance:
Former support has now turned into resistance (highlighted in blue text: "SUPPOT").
📉 Bearish Projection:
The projected path indicates a possible retest of the resistance zone before a sell-off continuation.
Target area: around 194.500, marked as “TAEGET FAXS” (typo: should be “TARGET ZONE”).
🔄 Possible Scenarios:
✅ Bearish Continuation:
If price rejects again near 198.000, expect a bearish move toward 194.500.
⚠️ Invalidation:
A strong breakout above 198.460 would invalidate the bearish thesis and may resume bullish momentum.
🔚 Conclusion:
The pair is currently under pressure with a confirmed break in trend structure. As long as price remains below 198.460, the bias remains bearish with a target toward the 194.500 zone. 📉👀
📌 Technical Analysis Overview:
The chart illustrates a clear rejection from the resistance zone around 198.460, where previous price action formed a double-top pattern (🔴 red arrow). This suggests a strong supply area with selling pressure building.
🔍 Key Observations:
📏 Trendline Break:
The upward trendline (blue) has been decisively broken.
This break signals a loss of bullish momentum.
🧱 Resistance Zone @ 198.000–198.460:
Price tested this zone multiple times but failed to break above.
Acts now as a strong resistance zone.
🟠 Support Turned Resistance:
Former support has now turned into resistance (highlighted in blue text: "SUPPOT").
📉 Bearish Projection:
The projected path indicates a possible retest of the resistance zone before a sell-off continuation.
Target area: around 194.500, marked as “TAEGET FAXS” (typo: should be “TARGET ZONE”).
🔄 Possible Scenarios:
✅ Bearish Continuation:
If price rejects again near 198.000, expect a bearish move toward 194.500.
⚠️ Invalidation:
A strong breakout above 198.460 would invalidate the bearish thesis and may resume bullish momentum.
🔚 Conclusion:
The pair is currently under pressure with a confirmed break in trend structure. As long as price remains below 198.460, the bias remains bearish with a target toward the 194.500 zone. 📉👀
JOIN MY TELEGRAM CHANNEL
t.me/StellarMarketAnalysis
JOIN MY RECOMMENTED BROKER REFFREL LINK
⤵️one.exnesstrack.net/a/uvd1etcgg1
PARTNER CODE⤵️
uvd1etcgg1
t.me/StellarMarketAnalysis
JOIN MY RECOMMENTED BROKER REFFREL LINK
⤵️one.exnesstrack.net/a/uvd1etcgg1
PARTNER CODE⤵️
uvd1etcgg1
Disclaimer
The information and publications are not meant to be, and do not constitute, financial, investment, trading, or other types of advice or recommendations supplied or endorsed by TradingView. Read more in the Terms of Use.