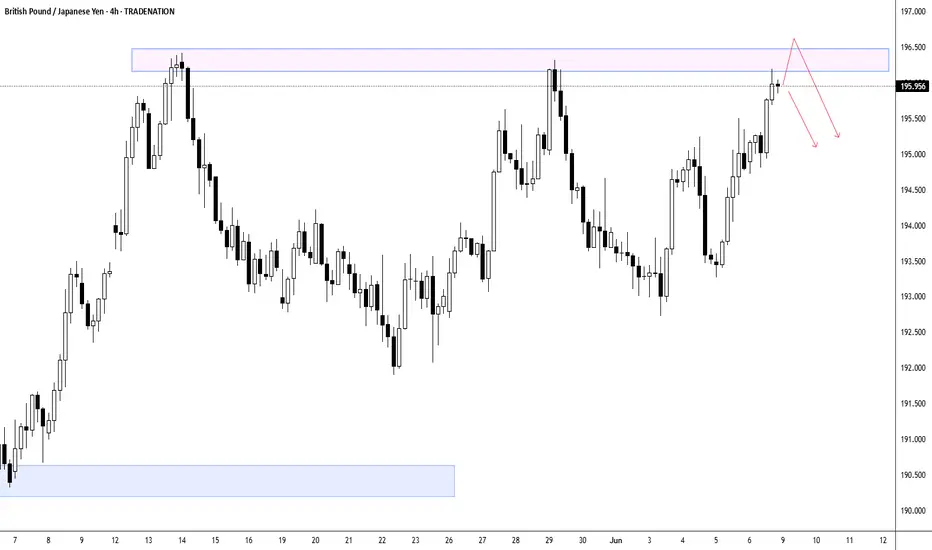
The GBP/JPY 4-hour chart reveals the pair is approaching a critical resistance zone around the 196.00-196.50 level, marked by the upper boundary of the highlighted rectangular area, which represents a significant technical ceiling that has been tested multiple times over the past month. This resistance level coincides with previous swing highs and appears to be acting as a formidable barrier to further upside progress, suggesting that traders should exercise heightened caution as selling pressure is likely to intensify in this area. The pair's recent rally from the May lows around 190.50 has been impressive, but the multiple rejections from this upper resistance zone indicate that institutional sellers may be positioned to defend these levels aggressively. Given the historical significance of this resistance area and the potential for profit-taking after the substantial advance, market participants should be prepared for increased volatility and possible reversal signals as the pair approaches or tests this key technical barrier, making risk management particularly crucial at current levels.
Disclosure: I am part of Trade Nation's Influencer program and receive a monthly fee for using their TradingView charts in my analysis.
Disclosure: I am part of Trade Nation's Influencer program and receive a monthly fee for using their TradingView charts in my analysis.
Disclaimer
The information and publications are not meant to be, and do not constitute, financial, investment, trading, or other types of advice or recommendations supplied or endorsed by TradingView. Read more in the Terms of Use.
Disclaimer
The information and publications are not meant to be, and do not constitute, financial, investment, trading, or other types of advice or recommendations supplied or endorsed by TradingView. Read more in the Terms of Use.