SMC trading point update
Technical analysis of GBP/JPY (British Pound / Japanese Yen) based on multiple Technical signals on the 4-hour timeframe. Let's break it down in detail:
---
Overall Analysis Summary
Direction Bias: Bearish
Timeframe: 4H
Price (at analysis time): 195.033
Tool Used: EMA 200, RSI, Support/Resistance, Chart Pattern
---
Technical Components
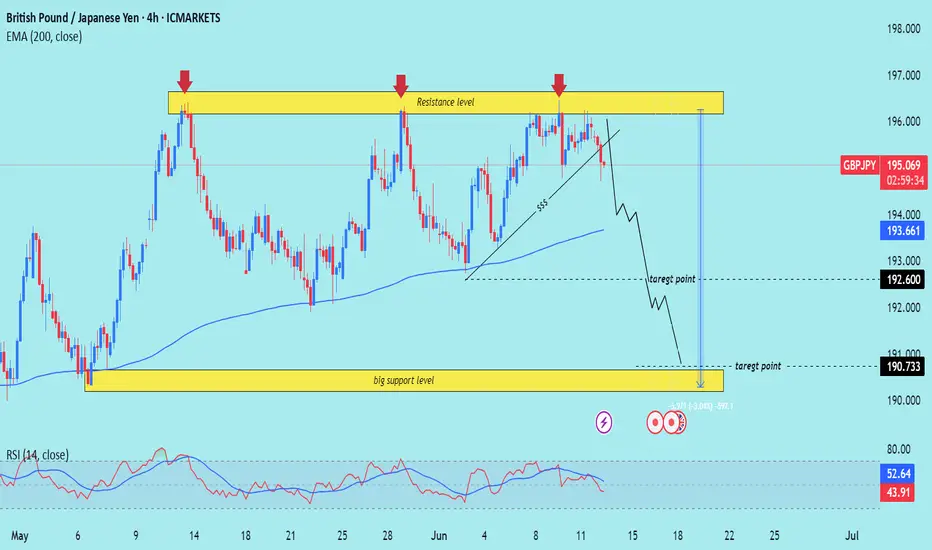
1. Strong Resistance Zone (~195.800 - 196.200)
Marked by 3 red arrows.
Price has rejected this level multiple times, forming a Triple Top pattern.
Suggests strong selling pressure and low probability of price breaking higher in the short term.
2. Trendline Break (Structure Shift)
Ascending support trendline (marked with "$$$") is broken.
This is a key market structure break, indicating the bullish momentum is weakening or reversing.
3. EMA 200 (193.661)
Price is currently just above the 200 EMA.
A clean break and close below the EMA would confirm trend reversal.
EMA often acts as dynamic support/resistance.
---
Target Zones
Two downside targets are indicated:
Target 1: 192.600
Minor support level, could be the first stop for bearish pressure.
Target 2: 190.733
Strong historical support zone (yellow box labeled big support level).
Also aligns with measured move from the top of the range to the base (height of the range).
---
RSI (Relative Strength Index)
RSI (14): ~43.40
Neutral zone (not oversold yet), meaning there’s room for more downside before oversold conditions are hit.
---
Trading Psychology & Risk Management
This setup assumes:
Sellers continue to defend the resistance zone.
Break of structure (trendline + EMA) confirms shift.
Traders may consider short entries below 194.800–195.000 with stops above 196.200.
---
Trade Idea (Based on This Chart)
Entry: Below 194.800 (after break confirmation)
Stop-Loss: Above 196.200
Take-Profit 1: 192.600
Take-Profit 2: 190.733
Risk-Reward: Favorable (~1:2+)
Mr SMC Trading point
---
Caution
If price reclaims 196.200 and closes above the resistance, bearish setup is invalidated.
Watch for fakeouts near EMA.
plesse support boost 🚀 this analysis)
Technical analysis of GBP/JPY (British Pound / Japanese Yen) based on multiple Technical signals on the 4-hour timeframe. Let's break it down in detail:
---
Overall Analysis Summary
Direction Bias: Bearish
Timeframe: 4H
Price (at analysis time): 195.033
Tool Used: EMA 200, RSI, Support/Resistance, Chart Pattern
---
Technical Components
1. Strong Resistance Zone (~195.800 - 196.200)
Marked by 3 red arrows.
Price has rejected this level multiple times, forming a Triple Top pattern.
Suggests strong selling pressure and low probability of price breaking higher in the short term.
2. Trendline Break (Structure Shift)
Ascending support trendline (marked with "$$$") is broken.
This is a key market structure break, indicating the bullish momentum is weakening or reversing.
3. EMA 200 (193.661)
Price is currently just above the 200 EMA.
A clean break and close below the EMA would confirm trend reversal.
EMA often acts as dynamic support/resistance.
---
Target Zones
Two downside targets are indicated:
Target 1: 192.600
Minor support level, could be the first stop for bearish pressure.
Target 2: 190.733
Strong historical support zone (yellow box labeled big support level).
Also aligns with measured move from the top of the range to the base (height of the range).
---
RSI (Relative Strength Index)
RSI (14): ~43.40
Neutral zone (not oversold yet), meaning there’s room for more downside before oversold conditions are hit.
---
Trading Psychology & Risk Management
This setup assumes:
Sellers continue to defend the resistance zone.
Break of structure (trendline + EMA) confirms shift.
Traders may consider short entries below 194.800–195.000 with stops above 196.200.
---
Trade Idea (Based on This Chart)
Entry: Below 194.800 (after break confirmation)
Stop-Loss: Above 196.200
Take-Profit 1: 192.600
Take-Profit 2: 190.733
Risk-Reward: Favorable (~1:2+)
Mr SMC Trading point
---
Caution
If price reclaims 196.200 and closes above the resistance, bearish setup is invalidated.
Watch for fakeouts near EMA.
plesse support boost 🚀 this analysis)
(Services:✔️ JOIN Telegram channel
#Gold trading ★Analysis★ 📊
Gold trading signals 🚀 99%
t.me/SmcTradingPoin
Join my recommended broker , link 👇
World best broker exness ✅D
one.exnesstrack.org/a/l1t1rf3p6v
#Gold trading ★Analysis★ 📊
Gold trading signals 🚀 99%
t.me/SmcTradingPoin
Join my recommended broker , link 👇
World best broker exness ✅D
one.exnesstrack.org/a/l1t1rf3p6v
Disclaimer
The information and publications are not meant to be, and do not constitute, financial, investment, trading, or other types of advice or recommendations supplied or endorsed by TradingView. Read more in the Terms of Use.