So I started following my first exotic as volatility of them had deterrent me due to lack of skills. Yet I’d reach the analytic level that I’m confident to trade and to post how to trade this beast of a pair.
So the monthly is the same as the weekly so let’s start here and tbh the lower timeframe don’t show any different Trend Structures.
Also I like to aid ppl in how to draw channels As we break down this pair thus this correction and education will help us and understand what we want to see, the markets direction as this is important to understand market psychology.
Channel N trendline suppose to isolate price not by highs and lows this is faulty and will lead to errors in assessments.
They are constructed to show isolate of price with rejection of a high and low. ONLY
Now what is rejection?
Rejection is a single candle Wick at a high or low.
It is not several candies at a high or low with wicks etc or whateva. This shows indecisive in that high or low and price will return their to either take it out With one candle or pass it.
So let’s keep this gem in mind as we go over this pair.
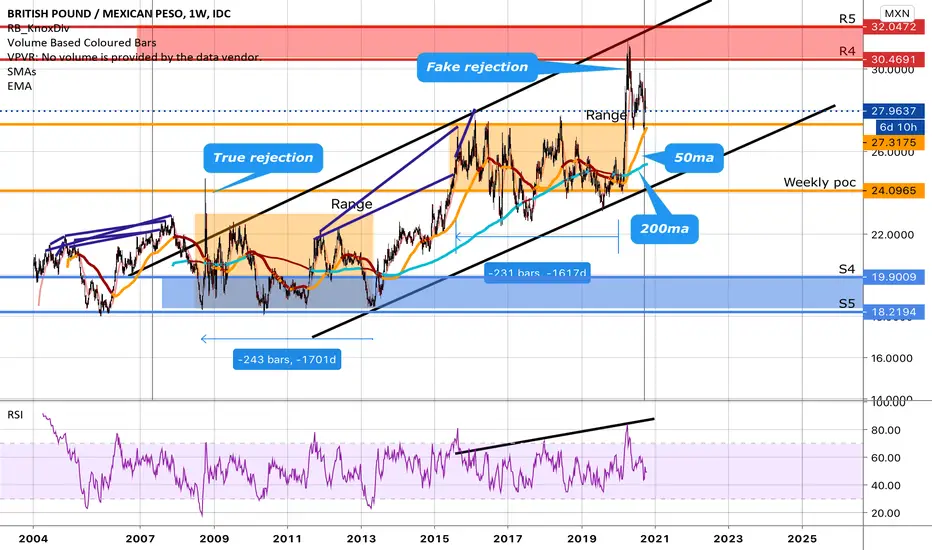
So note there is a rejection of a previous high with a single candle
Price retraces and go into a range
Next price breakout and take out this rejection.
This our first key sign
Cuz the marketed rejected that high. And from the range as ranges are virtually where all decisions are made price left the range to take this rejection out and then we get another range
Note the power behind this move as we are not talking about 5min daily or weekly movements we are talking years in development and efforts to break this rejection and then price goes back into a range and years later broke making another high
Now note the last breakout didn’t leave a rejection of the high as we have several candles in this area so this must be drawn inside the channel and the first one outside the channel to reflect price action. As I did here.
Now market psychology therefore tells us there is unfinished business at this new high. Thus we can assure price will go up to take it out either making a rejection of the high or surpassing the high. So there are many thousands of pips to catch in this move alone!!!
But let finish the break down
Note we have time action in play as each range is equal in distance thus we have a measured move which is crazy informative. It’s these subtle clues a market leaves for the knowledge trader to cash in.
This measured move tell us that they have a set agenda at a set time to accumulate their position with a set time to distribute it!! Follow me!!
Now we can see the driving force is bullish.
But there’s more.
Now note the red and blue the red is pivot r4 and 45 as the max resistance and s4 and s5 as max support.
So let’s put this together
We can see that they are driving this market up as price goes into the s4 zone but the key here is that the area got rejected falsely. This shows that they have the goals to take out the high as there isn’t a rejection of it.!!
So we can see the attempt as a breakout with a retest in play as this makes sense and such actions is needed to break a new high above heavy resistance a r4 or 45!,
So how to trade and what to expect
Well note how price broke out the second time I’m talking about and price used that range area as support not once but twice this shows the that price isn’t wanted low. And that resistance became support. Also not that the 50 and 200 are still in the range!
This is classics breakout material as we know that price will gravitate back to a range and to the averages and in this case it shows that price will go back into the range. And this is what we really want to see happen.
We want to see price actually enter the range and get spit back out!!
Now we can actually sell into the range and catch these thousands of pips cuz this is what is going to happen..
Or we can wait for price to get pushed back out the range and buy up to the high..
Now what to expect next well
As said price will make a new high but will it continue or will we have a reversal.
The reversal I doubt as theres much money involved to do all that is mentioned
But we can expect them to cash out on their positions
So I’m looking for a break of this high showing divergence with a single candle maybe at or above r5 with a fast bearish response giving us a deep pull back maybe breaking the low of the channel and Entering s4. here is where they may re enter their long positions either way there’s 100,000 of pips to ride here. Im already in.. how bout u?
HOW TO TRADE LIKE THEM-
So the monthly is the same as the weekly so let’s start here and tbh the lower timeframe don’t show any different Trend Structures.
Also I like to aid ppl in how to draw channels As we break down this pair thus this correction and education will help us and understand what we want to see, the markets direction as this is important to understand market psychology.
Channel N trendline suppose to isolate price not by highs and lows this is faulty and will lead to errors in assessments.
They are constructed to show isolate of price with rejection of a high and low. ONLY
Now what is rejection?
Rejection is a single candle Wick at a high or low.
It is not several candies at a high or low with wicks etc or whateva. This shows indecisive in that high or low and price will return their to either take it out With one candle or pass it.
So let’s keep this gem in mind as we go over this pair.
So note there is a rejection of a previous high with a single candle
Price retraces and go into a range
Next price breakout and take out this rejection.
This our first key sign
Cuz the marketed rejected that high. And from the range as ranges are virtually where all decisions are made price left the range to take this rejection out and then we get another range
Note the power behind this move as we are not talking about 5min daily or weekly movements we are talking years in development and efforts to break this rejection and then price goes back into a range and years later broke making another high
Now note the last breakout didn’t leave a rejection of the high as we have several candles in this area so this must be drawn inside the channel and the first one outside the channel to reflect price action. As I did here.
Now market psychology therefore tells us there is unfinished business at this new high. Thus we can assure price will go up to take it out either making a rejection of the high or surpassing the high. So there are many thousands of pips to catch in this move alone!!!
But let finish the break down
Note we have time action in play as each range is equal in distance thus we have a measured move which is crazy informative. It’s these subtle clues a market leaves for the knowledge trader to cash in.
This measured move tell us that they have a set agenda at a set time to accumulate their position with a set time to distribute it!! Follow me!!
Now we can see the driving force is bullish.
But there’s more.
Now note the red and blue the red is pivot r4 and 45 as the max resistance and s4 and s5 as max support.
So let’s put this together
We can see that they are driving this market up as price goes into the s4 zone but the key here is that the area got rejected falsely. This shows that they have the goals to take out the high as there isn’t a rejection of it.!!
So we can see the attempt as a breakout with a retest in play as this makes sense and such actions is needed to break a new high above heavy resistance a r4 or 45!,
So how to trade and what to expect
Well note how price broke out the second time I’m talking about and price used that range area as support not once but twice this shows the that price isn’t wanted low. And that resistance became support. Also not that the 50 and 200 are still in the range!
This is classics breakout material as we know that price will gravitate back to a range and to the averages and in this case it shows that price will go back into the range. And this is what we really want to see happen.
We want to see price actually enter the range and get spit back out!!
Now we can actually sell into the range and catch these thousands of pips cuz this is what is going to happen..
Or we can wait for price to get pushed back out the range and buy up to the high..
Now what to expect next well
As said price will make a new high but will it continue or will we have a reversal.
The reversal I doubt as theres much money involved to do all that is mentioned
But we can expect them to cash out on their positions
So I’m looking for a break of this high showing divergence with a single candle maybe at or above r5 with a fast bearish response giving us a deep pull back maybe breaking the low of the channel and Entering s4. here is where they may re enter their long positions either way there’s 100,000 of pips to ride here. Im already in.. how bout u?
HOW TO TRADE LIKE THEM-
Disclaimer
The information and publications are not meant to be, and do not constitute, financial, investment, trading, or other types of advice or recommendations supplied or endorsed by TradingView. Read more in the Terms of Use.
Disclaimer
The information and publications are not meant to be, and do not constitute, financial, investment, trading, or other types of advice or recommendations supplied or endorsed by TradingView. Read more in the Terms of Use.