This GBPNZD chart suggests a **potential long (buy) setup**, but only **after confirmation** via a **break of structure**, as indicated. Here's a full breakdown of the bullish scenario:
---
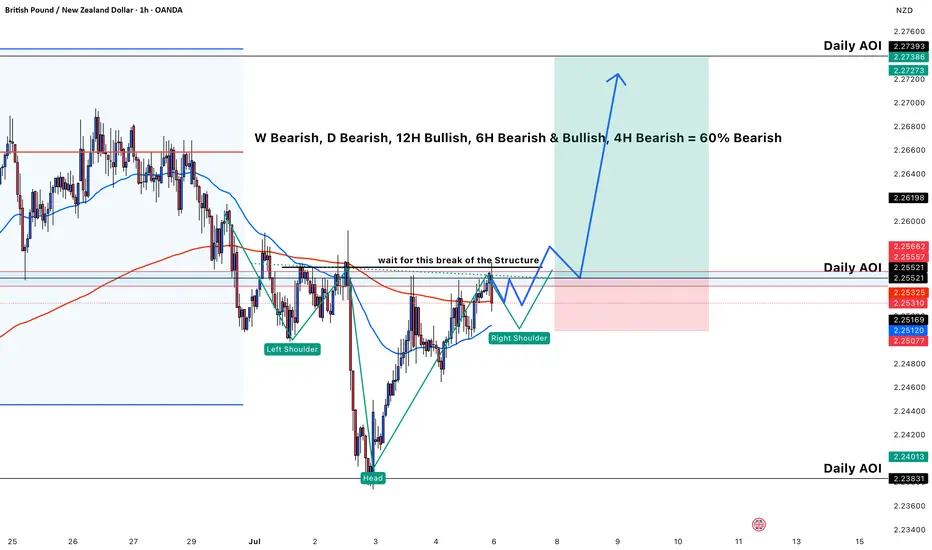
### 🧠 **Multi-Timeframe Analysis Bias**
* **Weekly: Bearish**
* **Daily: Bearish**
* **12H: Bullish**
* **6H: Mixed (Bearish & Bullish)**
* **4H: Bearish**
* ✅ Overall: **60% Bearish Bias** — but short-term strength is visible.
This means the trade is **counter-trend** on higher timeframes, but has potential due to **short-term structure shift**.
---
### 🧱 **Technical Structure – Inverse Head & Shoulders**
* A **bullish reversal pattern** is forming:
* **Left Shoulder**, **Head**, and **Right Shoulder** identified.
* Entry is planned **only after a clear break of the neckline** (resistance zone), confirming bullish momentum.
---
### 📍 **Key Zones**
* **Neckline / Resistance Zone**: \~2.2525–2.2565 — key level to break for confirmation.
* **Entry** is anticipated after a **successful breakout** and **bullish retest**.
* **Target**: Daily AOI around **2.2727–2.2739**.
* **Stop Loss**: Below the right shoulder, \~2.2507 or lower.
---
### 🧰 **Indicators and Confluences**
* Price is approaching both the **50 EMA** (blue) and **200 EMA** (red).
* A **break above these EMAs and structure** would likely trigger momentum buying.
* Right shoulder formed cleanly inside a **support zone**, providing a valid base for continuation.
---
### 💡 **Buy Trade Idea Summary**
* **Wait for confirmation**: break above 2.2565 structure.
* **Enter on retest** of broken neckline zone (blue arrows path).
* **Target**: 2.2727–2.2739 (Daily AOI).
* **Stop**: Below right shoulder (2.2500–2.2510).
* **Risk/Reward**: Favorable based on projected move and structure.
---
### 🧠 **Multi-Timeframe Analysis Bias**
* **Weekly: Bearish**
* **Daily: Bearish**
* **12H: Bullish**
* **6H: Mixed (Bearish & Bullish)**
* **4H: Bearish**
* ✅ Overall: **60% Bearish Bias** — but short-term strength is visible.
This means the trade is **counter-trend** on higher timeframes, but has potential due to **short-term structure shift**.
---
### 🧱 **Technical Structure – Inverse Head & Shoulders**
* A **bullish reversal pattern** is forming:
* **Left Shoulder**, **Head**, and **Right Shoulder** identified.
* Entry is planned **only after a clear break of the neckline** (resistance zone), confirming bullish momentum.
---
### 📍 **Key Zones**
* **Neckline / Resistance Zone**: \~2.2525–2.2565 — key level to break for confirmation.
* **Entry** is anticipated after a **successful breakout** and **bullish retest**.
* **Target**: Daily AOI around **2.2727–2.2739**.
* **Stop Loss**: Below the right shoulder, \~2.2507 or lower.
---
### 🧰 **Indicators and Confluences**
* Price is approaching both the **50 EMA** (blue) and **200 EMA** (red).
* A **break above these EMAs and structure** would likely trigger momentum buying.
* Right shoulder formed cleanly inside a **support zone**, providing a valid base for continuation.
---
### 💡 **Buy Trade Idea Summary**
* **Wait for confirmation**: break above 2.2565 structure.
* **Enter on retest** of broken neckline zone (blue arrows path).
* **Target**: 2.2727–2.2739 (Daily AOI).
* **Stop**: Below right shoulder (2.2500–2.2510).
* **Risk/Reward**: Favorable based on projected move and structure.
Trade active
I love this pair for the upcomig week.Disclaimer
The information and publications are not meant to be, and do not constitute, financial, investment, trading, or other types of advice or recommendations supplied or endorsed by TradingView. Read more in the Terms of Use.
Disclaimer
The information and publications are not meant to be, and do not constitute, financial, investment, trading, or other types of advice or recommendations supplied or endorsed by TradingView. Read more in the Terms of Use.