Hi guys,
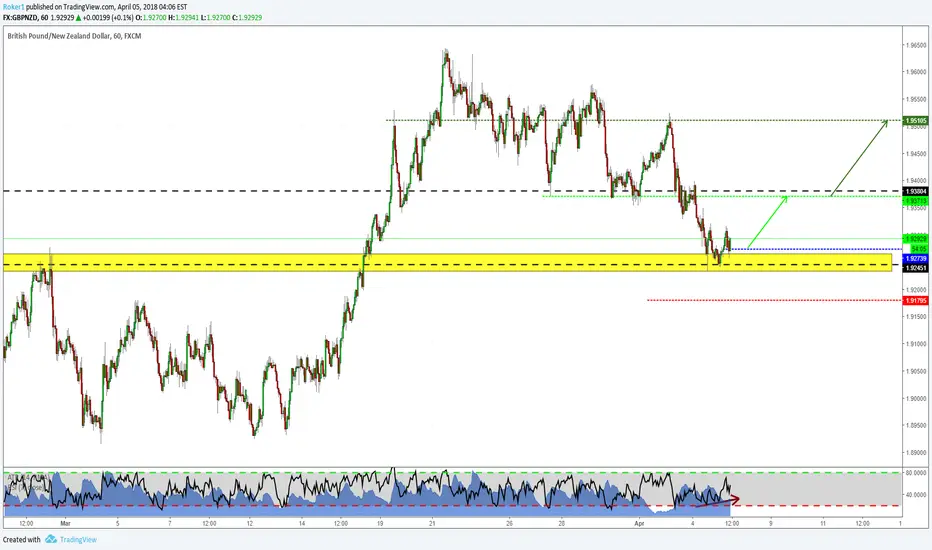
on the higher timeframes, like the daily, this pair is in an uptrend, because it broke to the upside the most recent resistance (upper black line). Now, until we broke a support to the downside, the trend will be considered bullish. Therefore, it makes sense to look for trading opportunities on lower timeframes, when we see there's higher timeframe structure looking left. Here we have a double bottom with RSI divergence and an engulfing on the 4H chart.
Entry at market, stops and targets as shown.
If you have any idea/question, feel free to comment below.
Otherwise, see you in the next chart!
Disclaimer
The information and publications are not meant to be, and do not constitute, financial, investment, trading, or other types of advice or recommendations supplied or endorsed by TradingView. Read more in the Terms of Use.
Disclaimer
The information and publications are not meant to be, and do not constitute, financial, investment, trading, or other types of advice or recommendations supplied or endorsed by TradingView. Read more in the Terms of Use.
