🔎 Weekly Overview:
Price has respected a key weekly support zone for two consecutive weeks, forming a bullish pin bar followed by a solid bullish candle this week. This shows strong buyer interest from a higher timeframe level.
📉 Daily Chart Explanation:
Daily structure has shifted to the upside. Price is now trading above both EMAs, signaling momentum strength. The internal bullish structure is building up with higher highs and higher lows.
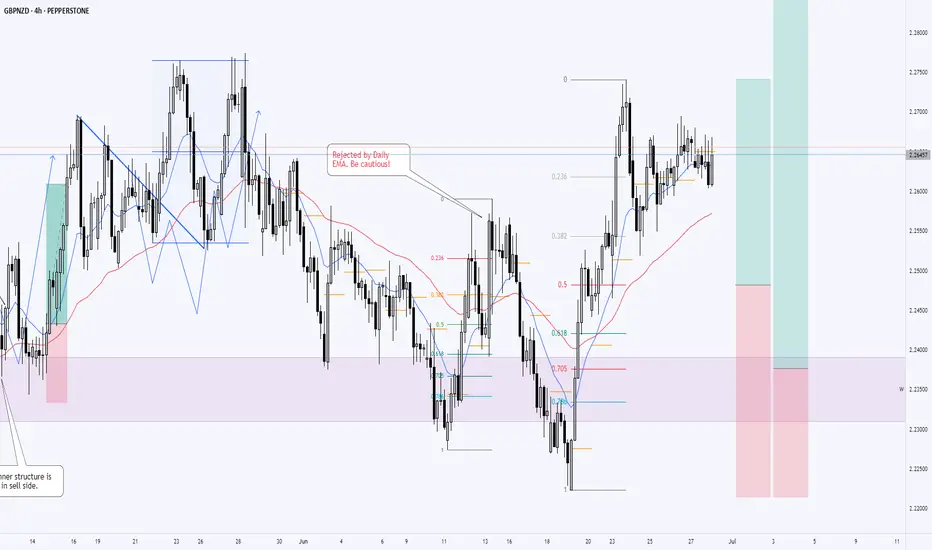
⏱ 4H Chart Explanation:
4-hour chart confirms the bullish narrative with a clean structure of higher highs and higher lows. Price has also broken above previous resistance levels, turning them into support.
🧭 Plan:
Bias: Bullish
Entry: Look for a pullback to recent 4H support or dynamic support near 14EMA/50EMA
Targets:
Recent 4H swing high
Next daily resistance zone
Invalidation: Below the most recent 4H higher low or if price closes back below EMAs with strong bearish momentum
📚 Educational Note:
Rejection pin bars at strong support levels followed by bullish continuation candles are high-probability reversal signals on weekly charts. When supported by bullish structure on lower timeframes, it builds a confluence that swing traders can capitalize on.
Price has respected a key weekly support zone for two consecutive weeks, forming a bullish pin bar followed by a solid bullish candle this week. This shows strong buyer interest from a higher timeframe level.
📉 Daily Chart Explanation:
Daily structure has shifted to the upside. Price is now trading above both EMAs, signaling momentum strength. The internal bullish structure is building up with higher highs and higher lows.
⏱ 4H Chart Explanation:
4-hour chart confirms the bullish narrative with a clean structure of higher highs and higher lows. Price has also broken above previous resistance levels, turning them into support.
🧭 Plan:
Bias: Bullish
Entry: Look for a pullback to recent 4H support or dynamic support near 14EMA/50EMA
Targets:
Recent 4H swing high
Next daily resistance zone
Invalidation: Below the most recent 4H higher low or if price closes back below EMAs with strong bearish momentum
📚 Educational Note:
Rejection pin bars at strong support levels followed by bullish continuation candles are high-probability reversal signals on weekly charts. When supported by bullish structure on lower timeframes, it builds a confluence that swing traders can capitalize on.
Disclaimer
The information and publications are not meant to be, and do not constitute, financial, investment, trading, or other types of advice or recommendations supplied or endorsed by TradingView. Read more in the Terms of Use.
Disclaimer
The information and publications are not meant to be, and do not constitute, financial, investment, trading, or other types of advice or recommendations supplied or endorsed by TradingView. Read more in the Terms of Use.