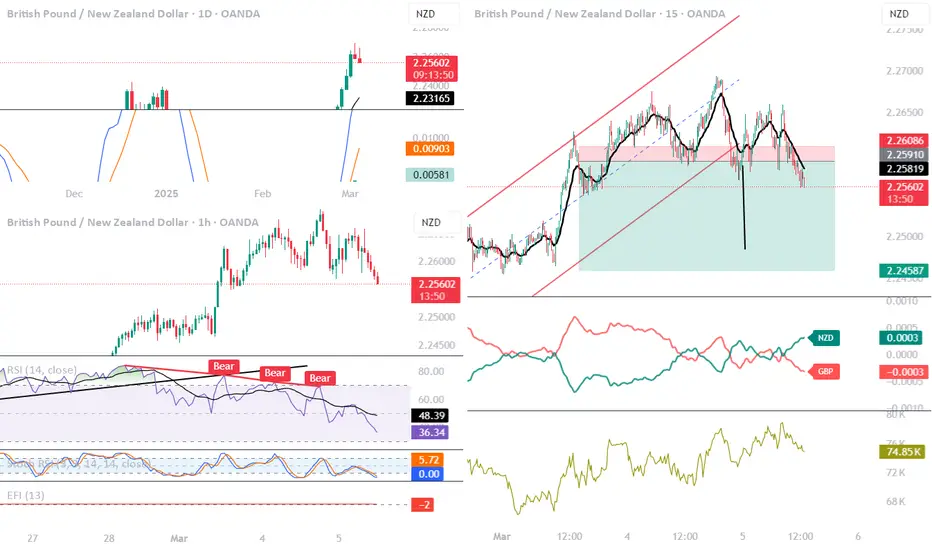
As of March 5, 2025, the GBP/NZD currency pair is exhibiting a potential bearish **Head and Shoulders** pattern on the daily chart. This classic reversal formation suggests that the prevailing uptrend may be nearing its end, with a possible shift towards bearish momentum.
**Pattern Breakdown:**
- **Left Shoulder:** Formed around early February 2025, where the price reached a peak near **2.2200** before retracing.
- **Head:** Established in mid-February 2025, with a higher peak approximately at **2.2500**, followed by a decline.
- **Right Shoulder:** Developed in late February 2025, peaking near **2.2200**, similar to the left shoulder, and subsequently moving downward.
- **Neckline:** Identified by connecting the lows between the shoulders and the head, currently around the **2.1900** level.
**Trade Considerations:**
- **Entry Point:** A decisive daily close below the neckline at **2.1900** could confirm the pattern, signaling a potential short entry.
- **Price Target:** The vertical distance from the head's peak (**2.2500**) to the neckline (**2.1900**) is **0.0600**. Subtracting this from the neckline suggests a target near **2.1300**.
- **Stop-Loss:** Consider placing a stop-loss above the right shoulder, around **2.2200**, to manage risk.
**Additional Insights:**
The Awesome Oscillator (AO) is indicating rising bearish sentiment, supporting the potential for downward movement. citeturn0search0
**Note:** While the Head and Shoulders pattern is a reliable reversal indicator, always incorporate other technical tools and fundamental analysis to strengthen trade decisions.
*For a visual representation, you can refer to the GBP/NZD chart on TradingView.* citeturn0search1 not financial advice
Disclaimer
The information and publications are not meant to be, and do not constitute, financial, investment, trading, or other types of advice or recommendations supplied or endorsed by TradingView. Read more in the Terms of Use.
Disclaimer
The information and publications are not meant to be, and do not constitute, financial, investment, trading, or other types of advice or recommendations supplied or endorsed by TradingView. Read more in the Terms of Use.