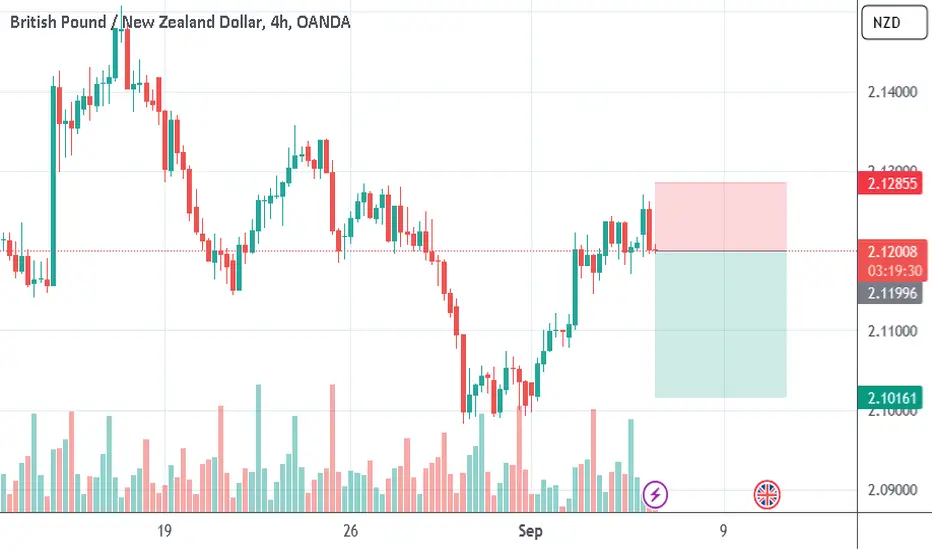
let’s dive into a bearish technical analysis of the GBPNZD H4 chart.
Bearish Indicators:
Trend Analysis:
The overall trend on the H4 chart has recently shifted from bullish to bearish1. This is indicated by a series of lower highs and lower lows forming on the chart.
Moving Averages:
The price is trading below the 50-period and 200-period Exponential Moving Averages (EMAs), which is a strong bearish signal2.
Relative Strength Index (RSI):
The RSI is currently below 50, suggesting bearish momentum2. If it continues to drop towards the oversold region (below 30), it could indicate further downside potential.
MACD (Moving Average Convergence Divergence):
The MACD line is below the signal line, and both are below the zero line, which confirms the bearish trend2.
Support and Resistance Levels:
The price is approaching a key support level around 2.1100. A break below this level could lead to further declines1.
Candlestick Patterns:
Recent candlestick patterns, such as bearish engulfing patterns, have been observed, indicating strong selling pressure1.
Potential Bearish Targets:
First Target: 2.1100 (near-term support level)
Second Target: 2.0950 (next significant support level)
Risk Management:
Stop Loss: Consider placing a stop loss above the recent swing high to manage risk effectively.
Disclaimer
The information and publications are not meant to be, and do not constitute, financial, investment, trading, or other types of advice or recommendations supplied or endorsed by TradingView. Read more in the Terms of Use.
Disclaimer
The information and publications are not meant to be, and do not constitute, financial, investment, trading, or other types of advice or recommendations supplied or endorsed by TradingView. Read more in the Terms of Use.
