GBP/USD|EMA200 Support&Trendline Holding–Bullish Potential Ahead
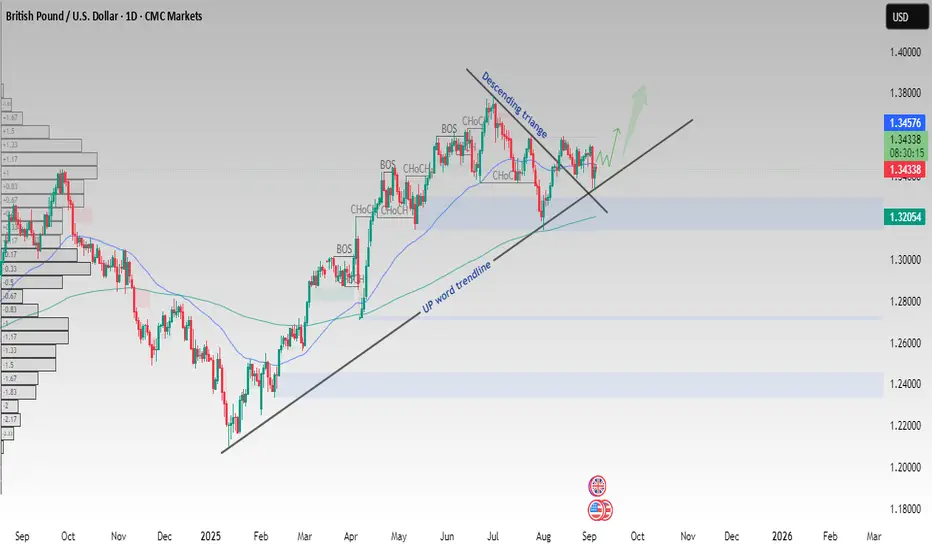
The GBP/USD daily chart is respecting the 200 EMA (blue line) as dynamic support, while also holding above the long-term uptrend line.
Key points from the chart setup:
✅ EMA200 acting as strong support – price rejected near this level multiple times.
✅ Uptrend structure intact – higher highs & higher lows remain valid.
✅ Descending triangle breakout – potential bullish continuation if price holds above trendline.
✅ Next resistance: 1.3457 zone.
✅ Support zone: 1.3205 demand area.
📈 If GBP/USD sustains above the EMA200 & trendline, bullish continuation toward 1.3457+ remains in play. A clean break below may open downside toward 1.3205 support.
This is not financial advice. Always use risk management.
Trade active
Trade has been active$ FOREX / GOLD / BTC | Real Trades,Real Result | Risk-managed strategiesn &VIP Signal {My Personal Entries} Join Telegram _ Trade smater ||
📬 Join Free Channel:
t.me/profitmagnetpro12
📬 Join Free Channel:
t.me/profitmagnetpro12
Related publications
Disclaimer
The information and publications are not meant to be, and do not constitute, financial, investment, trading, or other types of advice or recommendations supplied or endorsed by TradingView. Read more in the Terms of Use.
$ FOREX / GOLD / BTC | Real Trades,Real Result | Risk-managed strategiesn &VIP Signal {My Personal Entries} Join Telegram _ Trade smater ||
📬 Join Free Channel:
t.me/profitmagnetpro12
📬 Join Free Channel:
t.me/profitmagnetpro12
Related publications
Disclaimer
The information and publications are not meant to be, and do not constitute, financial, investment, trading, or other types of advice or recommendations supplied or endorsed by TradingView. Read more in the Terms of Use.