🔍 Disruption/Critique of the Current Target Analysis:
1. Lack of Technical Justification:
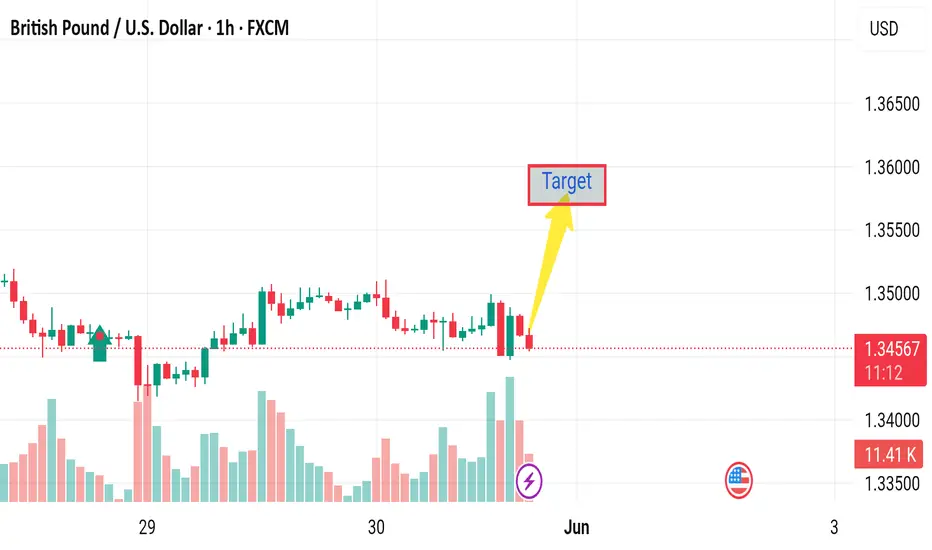
The chart marks a “Target” level without referencing a clear technical basis (e.g., resistance, Fibonacci level, or moving average).
Without a corresponding pattern or indicator signal (e.g., breakout, double bottom, divergence), the target seems arbitrary.
2. Volume Spike Misinterpretation:
While there’s a volume spike in the last candle, it's accompanied by a bearish candle, suggesting potential selling pressure, not buying strength.
A bullish continuation would ideally require a green candle with increasing volume, which is absent here.
3. Market Context Ignored:
No consideration of broader market context such as macroeconomic news, DXY strength, or interest rate expectations which heavily impact GBP/USD.
The U.S. flag icon indicates upcoming news – trading before such events can be risky and invalidate the technical target.
4. Resistance Zone Overlooked:
The “Target” lies near the 1.3500 psychological level, which often acts as resistance. This isn’t discussed or marked.
Recent price action near that level shows rejection, making it a questionable target without strong buying confirmation
1. Lack of Technical Justification:
The chart marks a “Target” level without referencing a clear technical basis (e.g., resistance, Fibonacci level, or moving average).
Without a corresponding pattern or indicator signal (e.g., breakout, double bottom, divergence), the target seems arbitrary.
2. Volume Spike Misinterpretation:
While there’s a volume spike in the last candle, it's accompanied by a bearish candle, suggesting potential selling pressure, not buying strength.
A bullish continuation would ideally require a green candle with increasing volume, which is absent here.
3. Market Context Ignored:
No consideration of broader market context such as macroeconomic news, DXY strength, or interest rate expectations which heavily impact GBP/USD.
The U.S. flag icon indicates upcoming news – trading before such events can be risky and invalidate the technical target.
4. Resistance Zone Overlooked:
The “Target” lies near the 1.3500 psychological level, which often acts as resistance. This isn’t discussed or marked.
Recent price action near that level shows rejection, making it a questionable target without strong buying confirmation
t.me/gold_free_signals1
𝙁𝙤𝙧𝙚𝙭 𝙩𝙧𝙖𝙙𝙞𝙣𝙜 𝙚𝙭𝙥𝙚𝙧𝙞𝙚𝙣𝙘𝙚 𝙩𝙚𝙖𝙢 ☺️ 𝙢𝙖𝙣𝙖𝙜𝙚 𝙮𝙤𝙪𝙧 𝙖𝙘𝙘𝙤𝙪𝙣𝙩 𝙢𝙖𝙠𝙞𝙣𝙜 𝙢𝙤𝙣𝙚𝙮 🤑💰
t.me/gold_free_signals1
𝙁𝙤𝙧𝙚𝙭 𝙩𝙧𝙖𝙙𝙞𝙣𝙜 𝙚𝙭𝙥𝙚𝙧𝙞𝙚𝙣𝙘𝙚 𝙩𝙚𝙖𝙢 ☺️ 𝙢𝙖𝙣𝙖𝙜𝙚 𝙮𝙤𝙪𝙧 𝙖𝙘𝙘𝙤𝙪𝙣𝙩 𝙢𝙖𝙠𝙞𝙣𝙜 𝙢𝙤𝙣𝙚𝙮 🤑💰
t.me/gold_free_signals1
Disclaimer
The information and publications are not meant to be, and do not constitute, financial, investment, trading, or other types of advice or recommendations supplied or endorsed by TradingView. Read more in the Terms of Use.
t.me/gold_free_signals1
𝙁𝙤𝙧𝙚𝙭 𝙩𝙧𝙖𝙙𝙞𝙣𝙜 𝙚𝙭𝙥𝙚𝙧𝙞𝙚𝙣𝙘𝙚 𝙩𝙚𝙖𝙢 ☺️ 𝙢𝙖𝙣𝙖𝙜𝙚 𝙮𝙤𝙪𝙧 𝙖𝙘𝙘𝙤𝙪𝙣𝙩 𝙢𝙖𝙠𝙞𝙣𝙜 𝙢𝙤𝙣𝙚𝙮 🤑💰
t.me/gold_free_signals1
𝙁𝙤𝙧𝙚𝙭 𝙩𝙧𝙖𝙙𝙞𝙣𝙜 𝙚𝙭𝙥𝙚𝙧𝙞𝙚𝙣𝙘𝙚 𝙩𝙚𝙖𝙢 ☺️ 𝙢𝙖𝙣𝙖𝙜𝙚 𝙮𝙤𝙪𝙧 𝙖𝙘𝙘𝙤𝙪𝙣𝙩 𝙢𝙖𝙠𝙞𝙣𝙜 𝙢𝙤𝙣𝙚𝙮 🤑💰
t.me/gold_free_signals1
Disclaimer
The information and publications are not meant to be, and do not constitute, financial, investment, trading, or other types of advice or recommendations supplied or endorsed by TradingView. Read more in the Terms of Use.