Hello everyone so this is my analysis over the past couple hours. I mean you guys can obviously see GBPUSD bullish. Let's dive a bit deeper into what's really happening...
Fundamentals: I'm seeing stronger GBP data coming into focus for Friday, April 11, 2025. Recent reports show that the UK's trade figures are working in its favor—for example, the non‑EU Goods Trade Balance improved from –£7.07B to –£6.7B, and the GDP MoM for February turned positive at 0.1% (up from –0.1%). Meanwhile, the overall GB Goods Trade Balance has also slightly improved. On the U.S. side, the latest reports (like a PPI MoM at 0.2% and lower Michigan Consumer Sentiment) point to some softness. For me, these fundamentals add extra conviction to a bullish view on GBP/USD because the UK economic data is beating expectations while the U.S. signals are lagging.
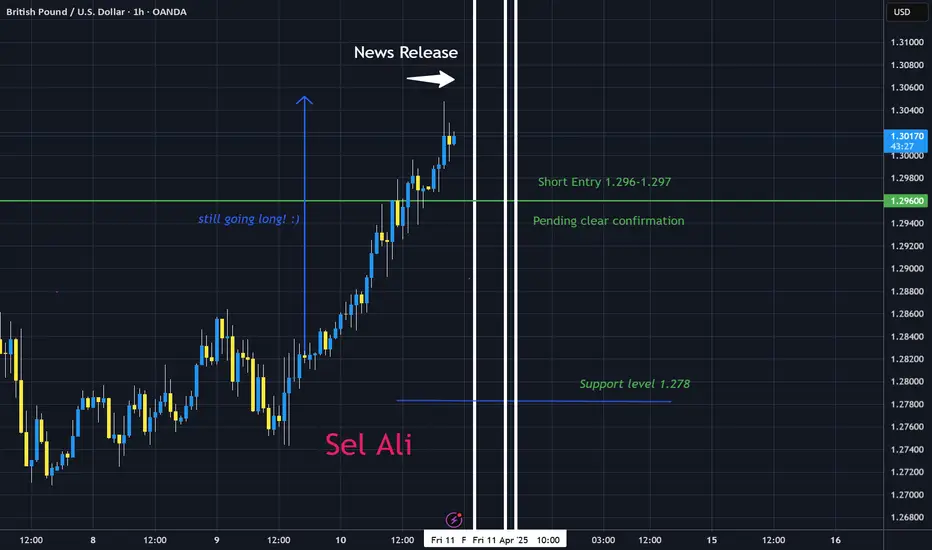
OHLC and Price Action: Looking over the hourly charts from today, I've observed that the price has been trading in a relatively narrow band—oscillating between about 1.286 and 1.299. Earlier in the session, there were strong upward moves (with notable gains around 10:00–11:00), but then at 15:00 I saw a pronounced pullback when the candle closed at 1.29375 after touching as high as 1.2979. Later, around 22:00, a bullish candle closed near 1.29876 with a +22.9 pips move, indicating that while buyers stepped in, the market remains choppy. This oscillation tells me that even though the long-term trend appears bullish, the near-term price action is showing signs of overextension and profit-taking.
Technical Indicators: My technical indicators paint a mixed picture. On higher timeframes (1‑hour and above), moving averages like the EMA, DEMA, and KAMA confirm that the overall trend is bullish. However, key support levels—like the HT_TRENDLINE (around 1.28267) and the Stop and Reverse level (about 1.29081)—are well below the current price of approximately 1.29807. This means that, relative to these supports, the price is overextended. Other indicators, like the 1‑hour RSI (hovering near 52) and the MACD, are fairly neutral, but the ATR (around 0.005) confirms that today's volatility is higher than normal. Short-term oscillators and candlestick patterns (such as bearish engulfing or pin bars on the 15‑minute chart) become critical for spotting a reversal signal.
My Overall View and Trade Strategy: Putting it all together, I’m keeping my bullish outlook on GBP/USD in the long run due to the favorable fundamental environment in the UK versus the U.S. On a technical level, however, the price appears overextended based on the OHLC action and indicator readings. I’m watching for clear reversal signals—the formation of a decisive bearish pattern around the 1.292–1.290 range would be my cue. If that happens, I’d close my current bullish trade and consider opening a short position, targeting a move down toward the 1.278–1.281 support area.
Fundamentals: I'm seeing stronger GBP data coming into focus for Friday, April 11, 2025. Recent reports show that the UK's trade figures are working in its favor—for example, the non‑EU Goods Trade Balance improved from –£7.07B to –£6.7B, and the GDP MoM for February turned positive at 0.1% (up from –0.1%). Meanwhile, the overall GB Goods Trade Balance has also slightly improved. On the U.S. side, the latest reports (like a PPI MoM at 0.2% and lower Michigan Consumer Sentiment) point to some softness. For me, these fundamentals add extra conviction to a bullish view on GBP/USD because the UK economic data is beating expectations while the U.S. signals are lagging.
OHLC and Price Action: Looking over the hourly charts from today, I've observed that the price has been trading in a relatively narrow band—oscillating between about 1.286 and 1.299. Earlier in the session, there were strong upward moves (with notable gains around 10:00–11:00), but then at 15:00 I saw a pronounced pullback when the candle closed at 1.29375 after touching as high as 1.2979. Later, around 22:00, a bullish candle closed near 1.29876 with a +22.9 pips move, indicating that while buyers stepped in, the market remains choppy. This oscillation tells me that even though the long-term trend appears bullish, the near-term price action is showing signs of overextension and profit-taking.
Technical Indicators: My technical indicators paint a mixed picture. On higher timeframes (1‑hour and above), moving averages like the EMA, DEMA, and KAMA confirm that the overall trend is bullish. However, key support levels—like the HT_TRENDLINE (around 1.28267) and the Stop and Reverse level (about 1.29081)—are well below the current price of approximately 1.29807. This means that, relative to these supports, the price is overextended. Other indicators, like the 1‑hour RSI (hovering near 52) and the MACD, are fairly neutral, but the ATR (around 0.005) confirms that today's volatility is higher than normal. Short-term oscillators and candlestick patterns (such as bearish engulfing or pin bars on the 15‑minute chart) become critical for spotting a reversal signal.
My Overall View and Trade Strategy: Putting it all together, I’m keeping my bullish outlook on GBP/USD in the long run due to the favorable fundamental environment in the UK versus the U.S. On a technical level, however, the price appears overextended based on the OHLC action and indicator readings. I’m watching for clear reversal signals—the formation of a decisive bearish pattern around the 1.292–1.290 range would be my cue. If that happens, I’d close my current bullish trade and consider opening a short position, targeting a move down toward the 1.278–1.281 support area.
Disclaimer
The information and publications are not meant to be, and do not constitute, financial, investment, trading, or other types of advice or recommendations supplied or endorsed by TradingView. Read more in the Terms of Use.
Disclaimer
The information and publications are not meant to be, and do not constitute, financial, investment, trading, or other types of advice or recommendations supplied or endorsed by TradingView. Read more in the Terms of Use.