Hello friends
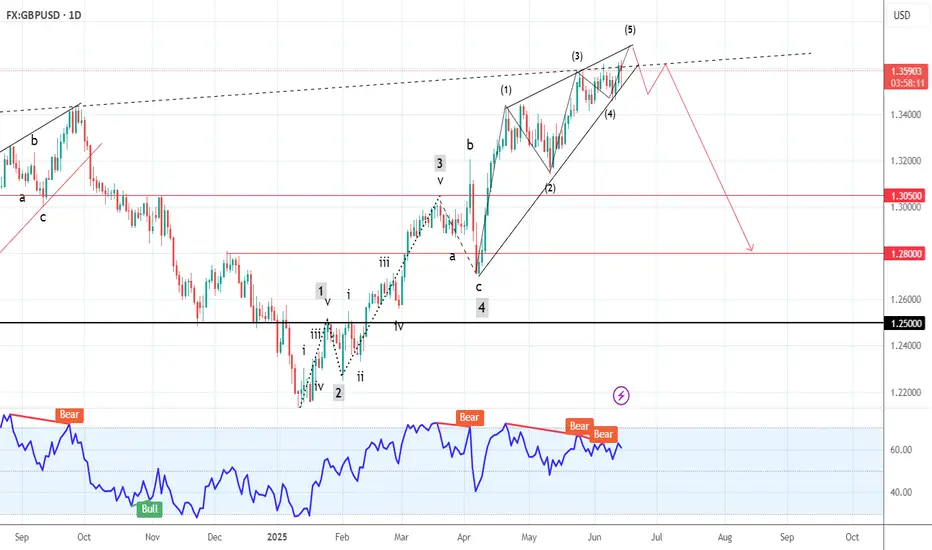
We are witnessing the formation of a complete Elliott wave pattern on the GBP USD chart. These waves from 1 to 5 are quite clear (of course, you can count them so that they become an ABC zigzag, isn't it interesting!) and you can even count their subwaves. Now wave 5 is completing and we are witnessing multiple divergences in wave 5. With the breakdown of the trend line drawn below and a pullback to it, we can expect the price to fall to the specified support. The first support is 1.305 and then 1.2800.
Good luck and be profitable.
Disclaimer
The information and publications are not meant to be, and do not constitute, financial, investment, trading, or other types of advice or recommendations supplied or endorsed by TradingView. Read more in the Terms of Use.
Disclaimer
The information and publications are not meant to be, and do not constitute, financial, investment, trading, or other types of advice or recommendations supplied or endorsed by TradingView. Read more in the Terms of Use.