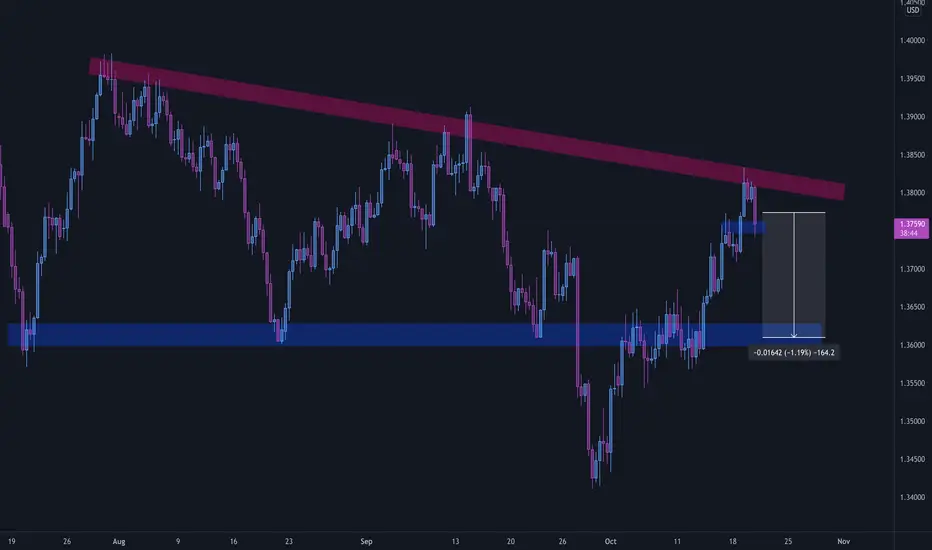
If we take a look at higher timeframe charts, we can observe that the price has formed a nice descending triangle pattern. A strong bearish candle has rejected the upper boundary of the formed triangle pattern and the price is now headed down from here. We are expecting for the price to keep dropping and reach the zone of crucial zone of demand identified on the graphical illustration
Disclaimer
The information and publications are not meant to be, and do not constitute, financial, investment, trading, or other types of advice or recommendations supplied or endorsed by TradingView. Read more in the Terms of Use.
Disclaimer
The information and publications are not meant to be, and do not constitute, financial, investment, trading, or other types of advice or recommendations supplied or endorsed by TradingView. Read more in the Terms of Use.