Market Analysis: GBP/USD Dips
GBP/USD failed to climb above 1.3800 and corrected some gains.
Important Takeaways for GBP/USD Analysis Today
- The British Pound is showing bearish signs below the 1.3700 support against the US dollar.
- There is a key bearish trend line forming with resistance near 1.3650 on the hourly chart of GBP/USD at FXOpen.
GBP/USD Technical Analysis

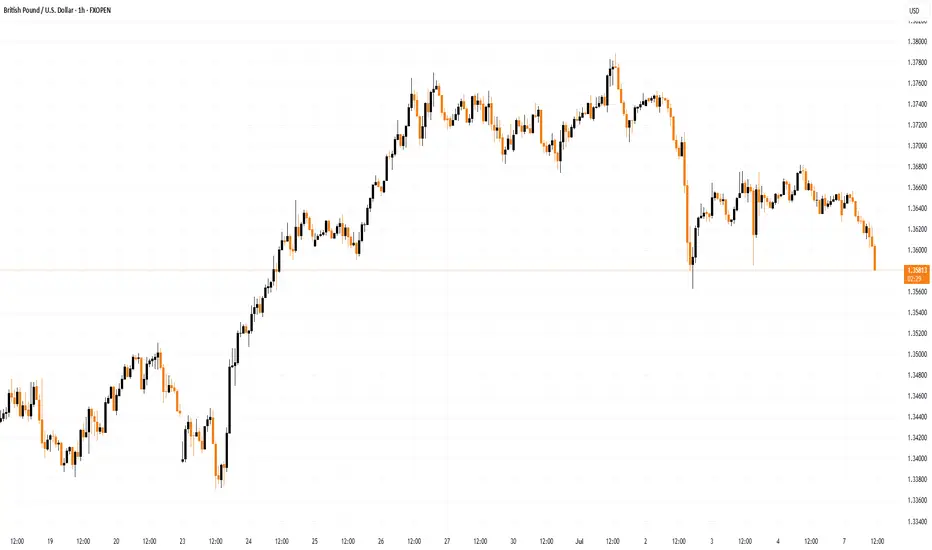
On the hourly chart of GBP/USD at FXOpen, the pair failed to stay above the 1.3750 pivot level. As a result, the British Pound started a fresh decline below 1.3720 against the US Dollar.
There was a clear move below 1.3700 and the 50-hour simple moving average. The bears pushed the pair below 1.3650. Finally, there was a spike below the 1.3600 support zone. A low was formed near 1.3562 and the pair is now consolidating losses.
There was a minor move above the 1.3615 level. On the upside, the GBP/USD chart indicates that the pair is facing resistance near the 1.3650 level. There is also a key bearish trend line forming with resistance near 1.3650.
The next major resistance is near the 50% Fib retracement level of the downward move from the 1.3788 swing high to the 1.3562 low at 1.3675. A close above the 1.3670 resistance zone could open the doors for a move toward the 1.3700 zone. The 61.8% Fib retracement level is at 1.3700. Any more gains might send GBP/USD toward 1.3790.
On the downside, there is a key support forming near 1.3615. If there is a downside break below the 1.3615 support, the pair could accelerate lower. The next major support is near the 1.3560 zone, below which the pair could test 1.3500. Any more losses could lead the pair toward the 1.3440 support.
This article represents the opinion of the Companies operating under the FXOpen brand only. It is not to be construed as an offer, solicitation, or recommendation with respect to products and services provided by the Companies operating under the FXOpen brand, nor is it to be considered financial advice.
GBP/USD failed to climb above 1.3800 and corrected some gains.
Important Takeaways for GBP/USD Analysis Today
- The British Pound is showing bearish signs below the 1.3700 support against the US dollar.
- There is a key bearish trend line forming with resistance near 1.3650 on the hourly chart of GBP/USD at FXOpen.
GBP/USD Technical Analysis
On the hourly chart of GBP/USD at FXOpen, the pair failed to stay above the 1.3750 pivot level. As a result, the British Pound started a fresh decline below 1.3720 against the US Dollar.
There was a clear move below 1.3700 and the 50-hour simple moving average. The bears pushed the pair below 1.3650. Finally, there was a spike below the 1.3600 support zone. A low was formed near 1.3562 and the pair is now consolidating losses.
There was a minor move above the 1.3615 level. On the upside, the GBP/USD chart indicates that the pair is facing resistance near the 1.3650 level. There is also a key bearish trend line forming with resistance near 1.3650.
The next major resistance is near the 50% Fib retracement level of the downward move from the 1.3788 swing high to the 1.3562 low at 1.3675. A close above the 1.3670 resistance zone could open the doors for a move toward the 1.3700 zone. The 61.8% Fib retracement level is at 1.3700. Any more gains might send GBP/USD toward 1.3790.
On the downside, there is a key support forming near 1.3615. If there is a downside break below the 1.3615 support, the pair could accelerate lower. The next major support is near the 1.3560 zone, below which the pair could test 1.3500. Any more losses could lead the pair toward the 1.3440 support.
This article represents the opinion of the Companies operating under the FXOpen brand only. It is not to be construed as an offer, solicitation, or recommendation with respect to products and services provided by the Companies operating under the FXOpen brand, nor is it to be considered financial advice.
Disclaimer
The information and publications are not meant to be, and do not constitute, financial, investment, trading, or other types of advice or recommendations supplied or endorsed by TradingView. Read more in the Terms of Use.
Disclaimer
The information and publications are not meant to be, and do not constitute, financial, investment, trading, or other types of advice or recommendations supplied or endorsed by TradingView. Read more in the Terms of Use.