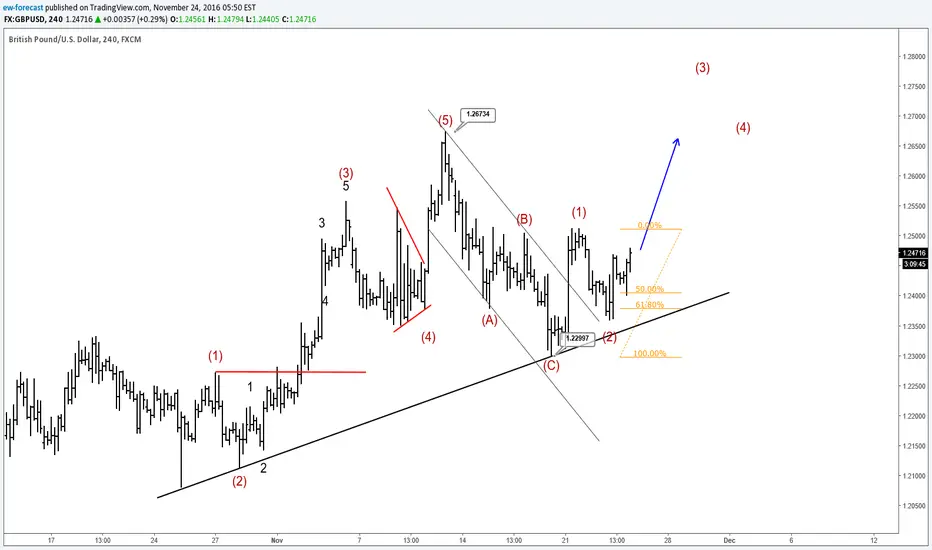
GBPUSD has been trading higher recently with a new leg up last week to 1.2680 where we called end of a five wave recovery from end of October. Notice that market then turned south but only with three waves that found a support at 1.2300 area. We can see a nice bounce from a trendline support which sent price back to 1.2500 level and above. It looks like an impulsive wave 1) so more gains may follow in days ahead, but after a pullback in wave 2), which can be interesting to join the trend for a new leg up to 1.2670. Support for this undergoing wave 2) may be around the 61.8 Fibonacci ratio, from where bulls seem to have taken off.
At the moment we can see some bullish intra-day activity taking place, ideally staring a new impulsive wave higher.
At the moment we can see some bullish intra-day activity taking place, ideally staring a new impulsive wave higher.
US Single STOCKS (FREE Access), FX, Crypto
👉Explore Our Services @ wavetraders.com/elliott-wave-plans/
Learn Elliott Waves
👉 wavetraders.com/academy/
Newsletter Sign up
👉 bit.ly/3FVPVzO
👉Explore Our Services @ wavetraders.com/elliott-wave-plans/
Learn Elliott Waves
👉 wavetraders.com/academy/
Newsletter Sign up
👉 bit.ly/3FVPVzO
Disclaimer
The information and publications are not meant to be, and do not constitute, financial, investment, trading, or other types of advice or recommendations supplied or endorsed by TradingView. Read more in the Terms of Use.