# GBPUSD Technical Analysis & Forecast
**Asset**: GBP/USD
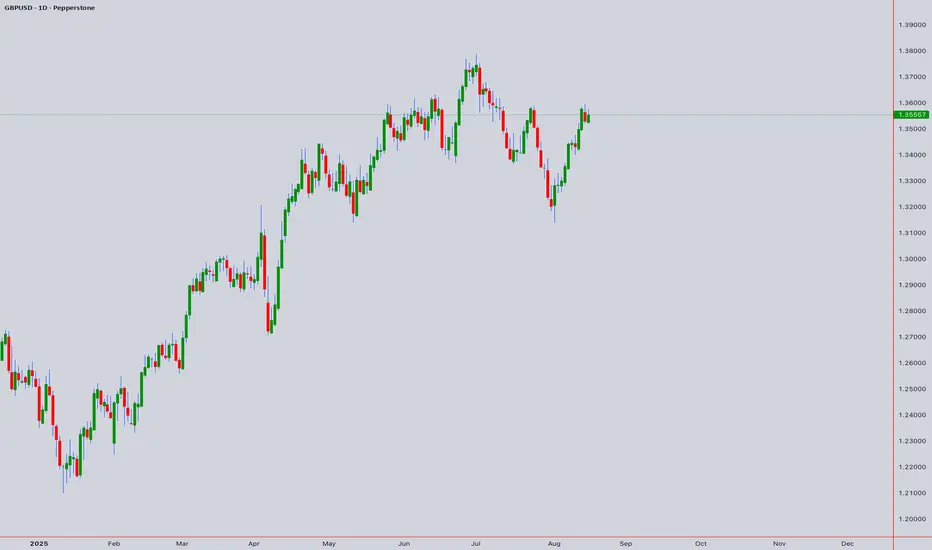
**Reference Price**: 1.35557 (August 16th, 2025, 12:50 AM UTC+4)
**Analysis Date**: August 17, 2025
## Executive Summary
GBPUSD is positioned at a critical juncture with multiple technical confluences suggesting potential bullish continuation. The pair has shown resilience above key support levels and appears to be forming a corrective structure that may lead to higher targets.
---
## 1. ELLIOTT WAVE ANALYSIS
### Primary Count (Daily/Weekly)
- **Current Position**: Gray Wave 3 (Impulsive phase)
- **Sub-wave**: Orange Wave 5 active
- **Structure**: Bullish trend in impulsive mode
- **Completion Status**: Gray Wave 2 likely complete
### Intraday Perspective (1H-4H)
- **Pattern**: Double Three (WXY) corrective structure
- **Key Level**: Equal Legs zone providing support
- **Blue Box Area**: Critical support confluence around 1.3480-1.3520
- **Invalidation**: Break below red X connector invalidates bullish count
### Wave Targets
- **Immediate**: 1.3650-1.3700 (completion of current sub-wave)
- **Extended**: 1.3850-1.4000 (major resistance confluence)
---
## 2. HARMONIC ANALYSIS
### Active Patterns
**ABCD Pattern**
- **Status**: Potential completion near current levels
- **D Point**: Expected around 1.3480-1.3520
- **Target**: 1.3680-1.3750 (127.2% extension)
**Gartley Pattern (4H)**
- **Completion**: 78.6% retracement area
- **Support Zone**: 1.3500-1.3550
- **Targets**: 1.3650 (38.2%), 1.3720 (61.8%)
**Butterfly Formation (Daily)**
- **Status**: Monitoring for completion
- **Critical Zone**: 1.3480-1.3520
- **Upside Potential**: 1.3780-1.3850
---
## 3. WYCKOFF ANALYSIS
### Current Phase Assessment
**Phase**: Accumulation (Phase C - Spring Test)
- **Characteristics**: Testing of support with reduced volume
- **Smart Money Activity**: Accumulation at lower levels
- **Market Maker Position**: Building long positions
### Key Wyckoff Levels
- **Support**: 1.3480 (Last Point of Support - LPS)
- **Resistance**: 1.3650 (Automatic Rally - AR)
- **Breakout Target**: 1.3750+ (Sign of Strength - SOS)
---
## 4. W.D. GANN ANALYSIS
### Square of 9 Analysis
**Current Position**: 1.35557
- **Next Resistance**: 1.3650 (144° angle)
- **Major Resistance**: 1.3780 (180° angle)
- **Support**: 1.3480 (90° angle from previous high)
### Time Cycles
**Active Cycles**:
- 30-day cycle: Peak expected around August 25-28, 2025
- 90-day cycle: Major turn window September 15-20, 2025
### Gann Angles (Daily Chart)
- **1x1 Angle**: Rising from 1.3200 low
- **2x1 Angle**: Critical support at 1.3450
- **1x2 Angle**: Resistance at 1.3720
### Price Forecasting
**Natural Resistance Levels** (Square of 9):
- 1.3610 (Minor)
- 1.3680 (Moderate)
- 1.3750 (Strong)
- 1.3850 (Major)
---
## 5. ICHIMOKU KINKO HYO
### Cloud Analysis (Daily)
- **Cloud Status**: Bullish (green cloud)
- **Price Position**: Above cloud indicating uptrend
- **Tenkan-sen**: 1.3520 (dynamic support)
- **Kijun-sen**: 1.3480 (key support)
### Key Levels
- **Cloud Top**: 1.3450
- **Cloud Bottom**: 1.3380
- **Senkou Span B**: 1.3420 (26-period ahead)
### Signals
- **Bullish Crossover**: Tenkan above Kijun
- **Future Cloud**: Remains bullish through September
---
## 6. JAPANESE CANDLESTICK ANALYSIS
### Recent Patterns (4H/Daily)
**Doji Star Formation**:
- **Location**: Near 1.3550 resistance
- **Implication**: Indecision, potential reversal higher
- **Confirmation**: Needed above 1.3580
**Hammer Pattern (Daily)**:
- **Formation**: August 15th low
- **Support**: 1.3480 area
- **Bullish Bias**: If sustained above 1.3520
### Pattern Projections
- **Engulfing Pattern**: Target 1.3650-1.3680
- **Three White Soldiers**: Potential if break above 1.3580
---
## 7. TECHNICAL INDICATORS ANALYSIS
### RSI (Relative Strength Index)
**Multi-Timeframe RSI Status**:
- **Daily**: 52.3 (Neutral with upward bias)
- **4H**: 48.7 (Slightly oversold, bullish divergence forming)
- **1H**: 45.2 (Oversold, bounce expected)
### Bollinger Bands
- **Daily**: Price at lower band, squeeze formation
- **4H**: Expansion phase beginning
- **Target**: Upper band at 1.3720-1.3750
### VWAP (Volume Weighted Average Price)
- **Daily VWAP**: 1.3530 (current resistance)
- **Weekly VWAP**: 1.3480 (key support)
- **Deviation Bands**: +1σ at 1.3620, +2σ at 1.3680
---
## 8. MOVING AVERAGES CONFLUENCE
### Simple Moving Averages (SMA)
- **20 SMA**: 1.3540 (immediate resistance)
- **50 SMA**: 1.3520 (dynamic support)
- **200 SMA**: 1.3450 (major support)
### Exponential Moving Averages (EMA)
- **12 EMA**: 1.3565 (short-term resistance)
- **26 EMA**: 1.3535 (key pivot)
- **100 EMA**: 1.3480 (confluence support)
### Weighted Moving Average (WMA)
- **21 WMA**: 1.3550 (resistance to break)
- **Golden Cross**: Potential if 50 WMA crosses above 200 WMA
---
## 9. MULTI-TIMEFRAME ANALYSIS
### 5-Minute Chart
- **Trend**: Sideways consolidation
- **Support**: 1.3540
- **Resistance**: 1.3570
- **Breakout Direction**: Awaiting catalyst
### 15-Minute Chart
- **Pattern**: Ascending triangle
- **Breakout Target**: 1.3590-1.3610
- **Volume**: Decreasing on pullbacks (bullish)
### 30-Minute Chart
- **Trend**: Bullish flag formation
- **Measured Move**: 1.3650 target
- **Key Level**: 1.3555 support
### 1-Hour Chart
- **Elliott Wave**: Corrective Wave 4 completion
- **Harmonic**: ABCD pattern near D point
- **Target**: 1.3620-1.3650
### 4-Hour Chart
- **Primary Trend**: Bullish
- **Correction**: Complex WXY structure
- **Upside Target**: 1.3750-1.3800
### Daily Chart
- **Major Trend**: Upward
- **Pattern**: Bull flag continuation
- **Long-term Target**: 1.3850-1.4000
### Weekly Chart
- **Structure**: Impulsive Wave 3
- **Support**: 1.3400-1.3450
- **Resistance**: 1.3800-1.3850
### Monthly Chart
- **Trend**: Long-term bullish
- **Key Resistance**: 1.4000-1.4200
- **Major Support**: 1.3200-1.3300
---
## 10. TRADING STRATEGY & OUTLOOK
### Intraday Strategy (5M-1H)
**Setup**: Buy dips approach
- **Entry Zone**: 1.3540-1.3560
- **Stop Loss**: 1.3520
- **Target 1**: 1.3590
- **Target 2**: 1.3620
### Swing Trading Strategy (4H-Daily)
**Setup**: Breakout continuation
- **Entry**: Above 1.3580 (confirmed breakout)
- **Stop Loss**: 1.3510
- **Target 1**: 1.3680
- **Target 2**: 1.3750
- **Target 3**: 1.3850
### Position Trading (Weekly-Monthly)
**Setup**: Long-term bullish bias
- **Accumulation Zone**: 1.3480-1.3550
- **Major Target**: 1.3850-1.4000
- **Risk Management**: Trail stops below key moving averages
---
## 11. KEY LEVELS SUMMARY
### Critical Support Levels
1. **1.3520** - Immediate support (Tenkan-sen, 50 SMA)
2. **1.3480** - Major support (Blue Box, Kijun-sen, 100 EMA)
3. **1.3450** - Cloud top, 200 SMA confluence
4. **1.3400** - Weekly support level
### Critical Resistance Levels
1. **1.3580** - Immediate resistance (breakout level)
2. **1.3620** - VWAP +1σ, harmonic target
3. **1.3680** - Bollinger upper band, Gann resistance
4. **1.3750** - Major confluence resistance
5. **1.3850** - Elliott Wave target, monthly resistance
---
## 12. RISK ASSESSMENT
### Bullish Scenario (Probability: 65%)
- **Catalyst**: Break above 1.3580
- **Target**: 1.3750-1.3850
- **Timeline**: 2-3 weeks
### Bearish Scenario (Probability: 35%)
- **Invalidation**: Break below 1.3480
- **Target**: 1.3400-1.3350
- **Timeline**: 1-2 weeks
### Key Events to Watch
1. Central bank communications
2. Economic data releases
3. Risk sentiment shifts
4. Technical breakout confirmations
---
## CONCLUSION
GBPUSD is positioned for potential upside continuation based on multiple technical confluence factors. The Elliott Wave analysis suggests we're in an impulsive upward structure, while harmonic patterns indicate completion of corrective phases. Gann analysis supports higher targets with favorable time cycles approaching.
**Recommended Bias**: Cautiously Bullish
**Primary Strategy**: Buy dips near support, target higher levels
**Risk Management**: Strict stops below key support confluences
The technical picture favors patient bulls who can capitalize on the current consolidation phase for potential moves toward 1.3750-1.3850 in the coming weeks.
For those interested in further developing their trading skills based on these types of analyses, consider exploring the mentoring program offered by Shunya dot Trade.(world wide web shunya dot trade)
I welcome your feedback on this analysis, as it will inform and enhance my future work.
Regards,
Shunya.Trade
world wide web shunya dot trade
⚠️ Disclaimer: This post is educational content and does not constitute investment advice, financial advice, or trading recommendations. The views expressed here are based on technical analysis and are shared solely for informational purposes. The stock market is subject to risks, including capital loss, and readers should exercise due diligence before investing. We do not take responsibility for decisions made based on this content. Consult a certified financial advisor for personalized guidance.
**Asset**: GBP/USD
**Reference Price**: 1.35557 (August 16th, 2025, 12:50 AM UTC+4)
**Analysis Date**: August 17, 2025
## Executive Summary
GBPUSD is positioned at a critical juncture with multiple technical confluences suggesting potential bullish continuation. The pair has shown resilience above key support levels and appears to be forming a corrective structure that may lead to higher targets.
---
## 1. ELLIOTT WAVE ANALYSIS
### Primary Count (Daily/Weekly)
- **Current Position**: Gray Wave 3 (Impulsive phase)
- **Sub-wave**: Orange Wave 5 active
- **Structure**: Bullish trend in impulsive mode
- **Completion Status**: Gray Wave 2 likely complete
### Intraday Perspective (1H-4H)
- **Pattern**: Double Three (WXY) corrective structure
- **Key Level**: Equal Legs zone providing support
- **Blue Box Area**: Critical support confluence around 1.3480-1.3520
- **Invalidation**: Break below red X connector invalidates bullish count
### Wave Targets
- **Immediate**: 1.3650-1.3700 (completion of current sub-wave)
- **Extended**: 1.3850-1.4000 (major resistance confluence)
---
## 2. HARMONIC ANALYSIS
### Active Patterns
**ABCD Pattern**
- **Status**: Potential completion near current levels
- **D Point**: Expected around 1.3480-1.3520
- **Target**: 1.3680-1.3750 (127.2% extension)
**Gartley Pattern (4H)**
- **Completion**: 78.6% retracement area
- **Support Zone**: 1.3500-1.3550
- **Targets**: 1.3650 (38.2%), 1.3720 (61.8%)
**Butterfly Formation (Daily)**
- **Status**: Monitoring for completion
- **Critical Zone**: 1.3480-1.3520
- **Upside Potential**: 1.3780-1.3850
---
## 3. WYCKOFF ANALYSIS
### Current Phase Assessment
**Phase**: Accumulation (Phase C - Spring Test)
- **Characteristics**: Testing of support with reduced volume
- **Smart Money Activity**: Accumulation at lower levels
- **Market Maker Position**: Building long positions
### Key Wyckoff Levels
- **Support**: 1.3480 (Last Point of Support - LPS)
- **Resistance**: 1.3650 (Automatic Rally - AR)
- **Breakout Target**: 1.3750+ (Sign of Strength - SOS)
---
## 4. W.D. GANN ANALYSIS
### Square of 9 Analysis
**Current Position**: 1.35557
- **Next Resistance**: 1.3650 (144° angle)
- **Major Resistance**: 1.3780 (180° angle)
- **Support**: 1.3480 (90° angle from previous high)
### Time Cycles
**Active Cycles**:
- 30-day cycle: Peak expected around August 25-28, 2025
- 90-day cycle: Major turn window September 15-20, 2025
### Gann Angles (Daily Chart)
- **1x1 Angle**: Rising from 1.3200 low
- **2x1 Angle**: Critical support at 1.3450
- **1x2 Angle**: Resistance at 1.3720
### Price Forecasting
**Natural Resistance Levels** (Square of 9):
- 1.3610 (Minor)
- 1.3680 (Moderate)
- 1.3750 (Strong)
- 1.3850 (Major)
---
## 5. ICHIMOKU KINKO HYO
### Cloud Analysis (Daily)
- **Cloud Status**: Bullish (green cloud)
- **Price Position**: Above cloud indicating uptrend
- **Tenkan-sen**: 1.3520 (dynamic support)
- **Kijun-sen**: 1.3480 (key support)
### Key Levels
- **Cloud Top**: 1.3450
- **Cloud Bottom**: 1.3380
- **Senkou Span B**: 1.3420 (26-period ahead)
### Signals
- **Bullish Crossover**: Tenkan above Kijun
- **Future Cloud**: Remains bullish through September
---
## 6. JAPANESE CANDLESTICK ANALYSIS
### Recent Patterns (4H/Daily)
**Doji Star Formation**:
- **Location**: Near 1.3550 resistance
- **Implication**: Indecision, potential reversal higher
- **Confirmation**: Needed above 1.3580
**Hammer Pattern (Daily)**:
- **Formation**: August 15th low
- **Support**: 1.3480 area
- **Bullish Bias**: If sustained above 1.3520
### Pattern Projections
- **Engulfing Pattern**: Target 1.3650-1.3680
- **Three White Soldiers**: Potential if break above 1.3580
---
## 7. TECHNICAL INDICATORS ANALYSIS
### RSI (Relative Strength Index)
**Multi-Timeframe RSI Status**:
- **Daily**: 52.3 (Neutral with upward bias)
- **4H**: 48.7 (Slightly oversold, bullish divergence forming)
- **1H**: 45.2 (Oversold, bounce expected)
### Bollinger Bands
- **Daily**: Price at lower band, squeeze formation
- **4H**: Expansion phase beginning
- **Target**: Upper band at 1.3720-1.3750
### VWAP (Volume Weighted Average Price)
- **Daily VWAP**: 1.3530 (current resistance)
- **Weekly VWAP**: 1.3480 (key support)
- **Deviation Bands**: +1σ at 1.3620, +2σ at 1.3680
---
## 8. MOVING AVERAGES CONFLUENCE
### Simple Moving Averages (SMA)
- **20 SMA**: 1.3540 (immediate resistance)
- **50 SMA**: 1.3520 (dynamic support)
- **200 SMA**: 1.3450 (major support)
### Exponential Moving Averages (EMA)
- **12 EMA**: 1.3565 (short-term resistance)
- **26 EMA**: 1.3535 (key pivot)
- **100 EMA**: 1.3480 (confluence support)
### Weighted Moving Average (WMA)
- **21 WMA**: 1.3550 (resistance to break)
- **Golden Cross**: Potential if 50 WMA crosses above 200 WMA
---
## 9. MULTI-TIMEFRAME ANALYSIS
### 5-Minute Chart
- **Trend**: Sideways consolidation
- **Support**: 1.3540
- **Resistance**: 1.3570
- **Breakout Direction**: Awaiting catalyst
### 15-Minute Chart
- **Pattern**: Ascending triangle
- **Breakout Target**: 1.3590-1.3610
- **Volume**: Decreasing on pullbacks (bullish)
### 30-Minute Chart
- **Trend**: Bullish flag formation
- **Measured Move**: 1.3650 target
- **Key Level**: 1.3555 support
### 1-Hour Chart
- **Elliott Wave**: Corrective Wave 4 completion
- **Harmonic**: ABCD pattern near D point
- **Target**: 1.3620-1.3650
### 4-Hour Chart
- **Primary Trend**: Bullish
- **Correction**: Complex WXY structure
- **Upside Target**: 1.3750-1.3800
### Daily Chart
- **Major Trend**: Upward
- **Pattern**: Bull flag continuation
- **Long-term Target**: 1.3850-1.4000
### Weekly Chart
- **Structure**: Impulsive Wave 3
- **Support**: 1.3400-1.3450
- **Resistance**: 1.3800-1.3850
### Monthly Chart
- **Trend**: Long-term bullish
- **Key Resistance**: 1.4000-1.4200
- **Major Support**: 1.3200-1.3300
---
## 10. TRADING STRATEGY & OUTLOOK
### Intraday Strategy (5M-1H)
**Setup**: Buy dips approach
- **Entry Zone**: 1.3540-1.3560
- **Stop Loss**: 1.3520
- **Target 1**: 1.3590
- **Target 2**: 1.3620
### Swing Trading Strategy (4H-Daily)
**Setup**: Breakout continuation
- **Entry**: Above 1.3580 (confirmed breakout)
- **Stop Loss**: 1.3510
- **Target 1**: 1.3680
- **Target 2**: 1.3750
- **Target 3**: 1.3850
### Position Trading (Weekly-Monthly)
**Setup**: Long-term bullish bias
- **Accumulation Zone**: 1.3480-1.3550
- **Major Target**: 1.3850-1.4000
- **Risk Management**: Trail stops below key moving averages
---
## 11. KEY LEVELS SUMMARY
### Critical Support Levels
1. **1.3520** - Immediate support (Tenkan-sen, 50 SMA)
2. **1.3480** - Major support (Blue Box, Kijun-sen, 100 EMA)
3. **1.3450** - Cloud top, 200 SMA confluence
4. **1.3400** - Weekly support level
### Critical Resistance Levels
1. **1.3580** - Immediate resistance (breakout level)
2. **1.3620** - VWAP +1σ, harmonic target
3. **1.3680** - Bollinger upper band, Gann resistance
4. **1.3750** - Major confluence resistance
5. **1.3850** - Elliott Wave target, monthly resistance
---
## 12. RISK ASSESSMENT
### Bullish Scenario (Probability: 65%)
- **Catalyst**: Break above 1.3580
- **Target**: 1.3750-1.3850
- **Timeline**: 2-3 weeks
### Bearish Scenario (Probability: 35%)
- **Invalidation**: Break below 1.3480
- **Target**: 1.3400-1.3350
- **Timeline**: 1-2 weeks
### Key Events to Watch
1. Central bank communications
2. Economic data releases
3. Risk sentiment shifts
4. Technical breakout confirmations
---
## CONCLUSION
GBPUSD is positioned for potential upside continuation based on multiple technical confluence factors. The Elliott Wave analysis suggests we're in an impulsive upward structure, while harmonic patterns indicate completion of corrective phases. Gann analysis supports higher targets with favorable time cycles approaching.
**Recommended Bias**: Cautiously Bullish
**Primary Strategy**: Buy dips near support, target higher levels
**Risk Management**: Strict stops below key support confluences
The technical picture favors patient bulls who can capitalize on the current consolidation phase for potential moves toward 1.3750-1.3850 in the coming weeks.
For those interested in further developing their trading skills based on these types of analyses, consider exploring the mentoring program offered by Shunya dot Trade.(world wide web shunya dot trade)
I welcome your feedback on this analysis, as it will inform and enhance my future work.
Regards,
Shunya.Trade
world wide web shunya dot trade
⚠️ Disclaimer: This post is educational content and does not constitute investment advice, financial advice, or trading recommendations. The views expressed here are based on technical analysis and are shared solely for informational purposes. The stock market is subject to risks, including capital loss, and readers should exercise due diligence before investing. We do not take responsibility for decisions made based on this content. Consult a certified financial advisor for personalized guidance.
Disclaimer
The information and publications are not meant to be, and do not constitute, financial, investment, trading, or other types of advice or recommendations supplied or endorsed by TradingView. Read more in the Terms of Use.
Disclaimer
The information and publications are not meant to be, and do not constitute, financial, investment, trading, or other types of advice or recommendations supplied or endorsed by TradingView. Read more in the Terms of Use.