📉 GBP/USD Daily Chart Analysis – June 20, 2025 📊
📌 Chart Overview:
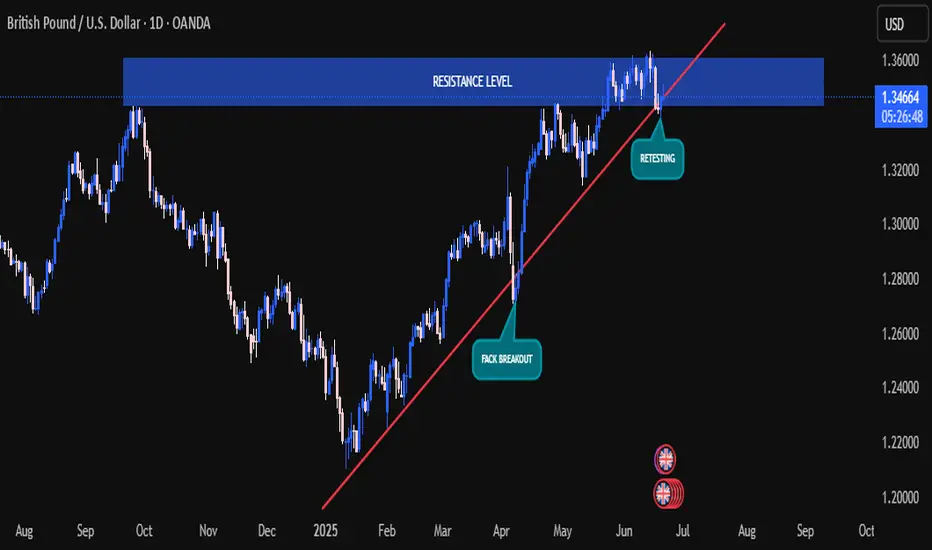
The GBP/USD pair is currently experiencing a critical technical phase. After a strong bullish rally from January 2025, price action has approached a key resistance level near the 1.3600 zone. Here's the detailed breakdown:
🟦 Key Highlights:
🔹 Resistance Zone 💥
Price is testing a major horizontal resistance between 1.3450 – 1.3600. This area has acted as a supply zone where sellers are currently active.
🔹 Trendline Support 🔺
A long-standing bullish trendline, active since early 2025, has been retested multiple times, confirming the trend’s strength.
🔹 Retest in Progress 🔄
Price recently pulled back after hitting the resistance and is now retesting the broken trendline, indicating a potential shift in trend if the trendline fails to hold.
🔹 Fake Breakout ⚠️
An earlier attempt to break below the trendline in April turned out to be a false breakout, which fueled bullish continuation. A similar scenario could be developing.
📊 Technical Outlook:
📈 If price breaks and closes above 1.3600, it would indicate strong bullish momentum and could open doors toward new highs.
📉 However, if the trendline breaks convincingly and retest fails, sellers may gain control with potential downside targets around 1.3200 and 1.3000.
📍 Conclusion:
GBP/USD is at a make-or-break zone 🧨. Traders should monitor the reaction at the trendline and resistance closely. Breakout or rejection here will shape the mid-term direction.
🔔 Watch for confirmation signals before entering positions.
📌 Chart Overview:
The GBP/USD pair is currently experiencing a critical technical phase. After a strong bullish rally from January 2025, price action has approached a key resistance level near the 1.3600 zone. Here's the detailed breakdown:
🟦 Key Highlights:
🔹 Resistance Zone 💥
Price is testing a major horizontal resistance between 1.3450 – 1.3600. This area has acted as a supply zone where sellers are currently active.
🔹 Trendline Support 🔺
A long-standing bullish trendline, active since early 2025, has been retested multiple times, confirming the trend’s strength.
🔹 Retest in Progress 🔄
Price recently pulled back after hitting the resistance and is now retesting the broken trendline, indicating a potential shift in trend if the trendline fails to hold.
🔹 Fake Breakout ⚠️
An earlier attempt to break below the trendline in April turned out to be a false breakout, which fueled bullish continuation. A similar scenario could be developing.
📊 Technical Outlook:
📈 If price breaks and closes above 1.3600, it would indicate strong bullish momentum and could open doors toward new highs.
📉 However, if the trendline breaks convincingly and retest fails, sellers may gain control with potential downside targets around 1.3200 and 1.3000.
📍 Conclusion:
GBP/USD is at a make-or-break zone 🧨. Traders should monitor the reaction at the trendline and resistance closely. Breakout or rejection here will shape the mid-term direction.
🔔 Watch for confirmation signals before entering positions.
Market Analysts, Mentor, Forex Trader.
#XAUUSD Trader
FREE ANALYSIS AT ENTRY POINT.
Your Growth Is My Priority link
t.me/VikingFxCommunityAcademy
#XAUUSD Trader
FREE ANALYSIS AT ENTRY POINT.
Your Growth Is My Priority link
t.me/VikingFxCommunityAcademy
Disclaimer
The information and publications are not meant to be, and do not constitute, financial, investment, trading, or other types of advice or recommendations supplied or endorsed by TradingView. Read more in the Terms of Use.