GBPUSD (2H) Bearish Analysis
1. Chart Structure
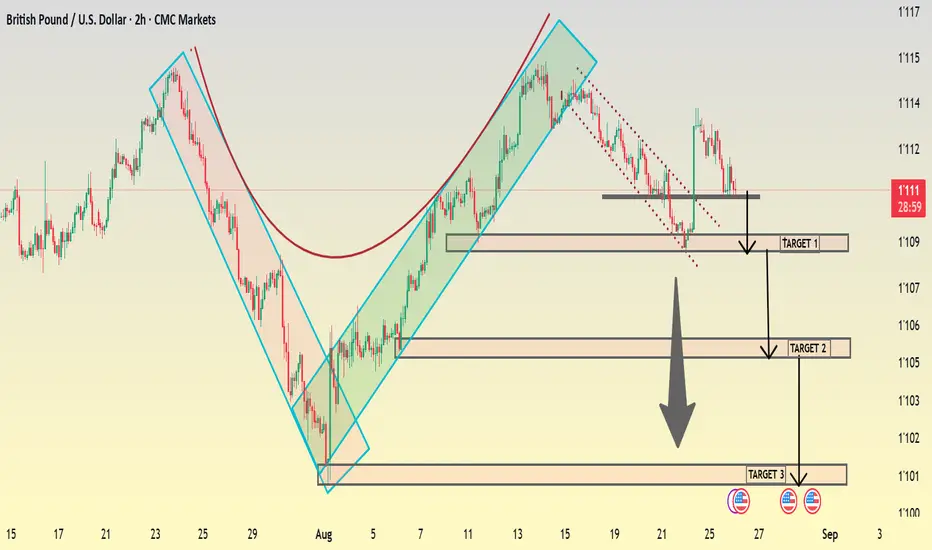
The chart shows a bearish channel (blue box) – price is respecting the downward slope.
The red arc highlights a rounded top pattern, a strong reversal signal.
Recent candles show failure to hold higher levels, confirming sellers are in control.
---
2. Entry & Current Zone
Entry Zone: Around 1.1110 – 1.1120 (bearish rejection area).
Price failed to break higher and is now trending back inside the bearish structure.
---
3. Bearish Targets
Target 1: 1.1070 → First demand zone & short-term liquidity grab.
Target 2: 1.1045 → Stronger support & midpoint of the structure.
Target 3: 1.1010 → Final major support & completion of full channel move.
---
4. Stop-loss & Invalidation
Stop-loss: Above 1.1145 – 1.1150
Reason: A breakout above this zone would invalidate the bearish channel and shift structure back bullish.
---
5. Risk–Reward Setup
Entry: 1.1110
SL: 1.1150 (40 pips risk)
TP1: 1.1070 (+40 pips → R:R = 1:1)
TP2: 1.1045 (+65 pips → R:R ≈ 1.6)
TP3: 1.1010 (+100 pips → R:R = 2.5)
---
6. Professional View
GBPUSD is in a bearish channel continuation.
Rounded top + rejection from channel resistance confirm further downside pressure.
Best strategy: Short from 1.1110 zone, scale out profits at TP1 & TP2, and hold remainder for TP3.
✅ Summary (Pro Signal)
GBPUSD short from 1.1110, SL above 1.1150, targets 1.1070 / 1.1045 / 1.1010.
Bearish channel + rounded top + resistance rejection = strong downside continuation.
1. Chart Structure
The chart shows a bearish channel (blue box) – price is respecting the downward slope.
The red arc highlights a rounded top pattern, a strong reversal signal.
Recent candles show failure to hold higher levels, confirming sellers are in control.
---
2. Entry & Current Zone
Entry Zone: Around 1.1110 – 1.1120 (bearish rejection area).
Price failed to break higher and is now trending back inside the bearish structure.
---
3. Bearish Targets
Target 1: 1.1070 → First demand zone & short-term liquidity grab.
Target 2: 1.1045 → Stronger support & midpoint of the structure.
Target 3: 1.1010 → Final major support & completion of full channel move.
---
4. Stop-loss & Invalidation
Stop-loss: Above 1.1145 – 1.1150
Reason: A breakout above this zone would invalidate the bearish channel and shift structure back bullish.
---
5. Risk–Reward Setup
Entry: 1.1110
SL: 1.1150 (40 pips risk)
TP1: 1.1070 (+40 pips → R:R = 1:1)
TP2: 1.1045 (+65 pips → R:R ≈ 1.6)
TP3: 1.1010 (+100 pips → R:R = 2.5)
---
6. Professional View
GBPUSD is in a bearish channel continuation.
Rounded top + rejection from channel resistance confirm further downside pressure.
Best strategy: Short from 1.1110 zone, scale out profits at TP1 & TP2, and hold remainder for TP3.
✅ Summary (Pro Signal)
GBPUSD short from 1.1110, SL above 1.1150, targets 1.1070 / 1.1045 / 1.1010.
Bearish channel + rounded top + resistance rejection = strong downside continuation.
Trade active
trade activeSmart Risk, Strong Mindset, Steady Profits
t.me/FX_AGENCY_COMMUNITY
Markets Reward the Prepared, Not the Lucky ”
t.me/FX_AGENCY_COMMUNITY
“Consistency is the Key to Trading Success .
t.me/FX_AGENCY_COMMUNITY
t.me/FX_AGENCY_COMMUNITY
Markets Reward the Prepared, Not the Lucky ”
t.me/FX_AGENCY_COMMUNITY
“Consistency is the Key to Trading Success .
t.me/FX_AGENCY_COMMUNITY
Disclaimer
The information and publications are not meant to be, and do not constitute, financial, investment, trading, or other types of advice or recommendations supplied or endorsed by TradingView. Read more in the Terms of Use.
Smart Risk, Strong Mindset, Steady Profits
t.me/FX_AGENCY_COMMUNITY
Markets Reward the Prepared, Not the Lucky ”
t.me/FX_AGENCY_COMMUNITY
“Consistency is the Key to Trading Success .
t.me/FX_AGENCY_COMMUNITY
t.me/FX_AGENCY_COMMUNITY
Markets Reward the Prepared, Not the Lucky ”
t.me/FX_AGENCY_COMMUNITY
“Consistency is the Key to Trading Success .
t.me/FX_AGENCY_COMMUNITY
Disclaimer
The information and publications are not meant to be, and do not constitute, financial, investment, trading, or other types of advice or recommendations supplied or endorsed by TradingView. Read more in the Terms of Use.