Core Analysis Method: Smart Money Concepts
😇7 Dimension Analysis
Time Frame: 15 minutes
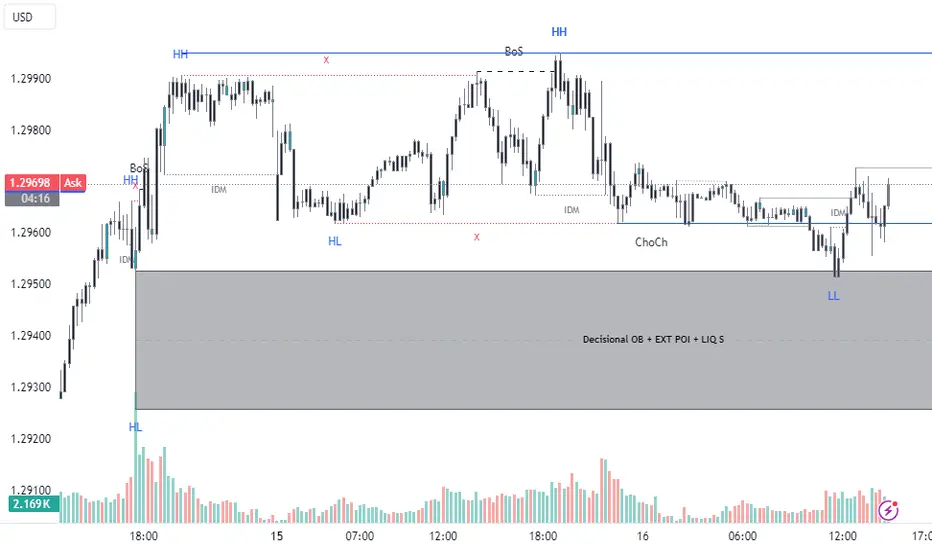
1: Swing Structure: Current structure shows a Bearish Side CHOCH, but in a broader view, this is just a liquidity sweep character. After tapping the liquidity area, the price gives a strong MSS and inducement. After that, the price also takes this minor structure POI and now starts an upward move again. At the same area, the price also sweeps the previous day's low liquidity.
🟢 Structure Behavior: Bullish
🟢 Swing Impulsive Move: Just started
🟢 Internal Structure: Bullish
🟢 Liquidity area sweep acts as POI in a powerful discounted zone
2: Pattern
🟢 CHART PATTERNS: No considerable pattern found here
🟢 CANDLE PATTERNS: After a Record Session count, the price makes a correction within the candle pattern. During correction at the same level, the price also makes a shooting star, ending the correction sign of the candle. Within the shooting star, an inside bar or narrow range is created, most probably it will break to the upside.
3: Volume
🟢 During the correction phase of the 15-minute structure, very low volume is observed in this corrective move. But now, when it touches the POI, a significant increase in volume bars is seen, indicating some big activity at this point.
4: Momentum RSI
🟢 In bearish to sideways zone, need to wait for confirmation of the range shift. At the same level, it also has an 80% confirm signal called RSI loud moves in the bullish side and 7* signal Grandfather father son entries (Andrew Cardwell RSI Concepts).
5: Volatility Bollinger Bands
🟢 At this point, expansion might be ending; now the price might take some rest before starting its move.
🟢 A bullish head fake also at the POI makes this area more attractive for buying.
6: Strength: GBP is stronger than USD in this time frame.
7: Sentiment: All sentiment indicates a strong buy.
✔️ Entry Time Frame: 15 minutes
✅ Entry TF Structure: Bullish
✔ Entry Time POI: FVG OB LIQ Everything confirm and mitigated
☑️ Trend line breakout: Confirm
💡 Decision: BUY
🚀 Entry: 1st 1.2962, 2nd 1.2941
✋ Stop loss: 1st 1.2923
🎯 Take profit: 1.3060
😊 Risk to reward Ratio: 6.5 RR
🕛 Expected Duration:
Trade closed: target reached
Disclaimer
The information and publications are not meant to be, and do not constitute, financial, investment, trading, or other types of advice or recommendations supplied or endorsed by TradingView. Read more in the Terms of Use.
Disclaimer
The information and publications are not meant to be, and do not constitute, financial, investment, trading, or other types of advice or recommendations supplied or endorsed by TradingView. Read more in the Terms of Use.
