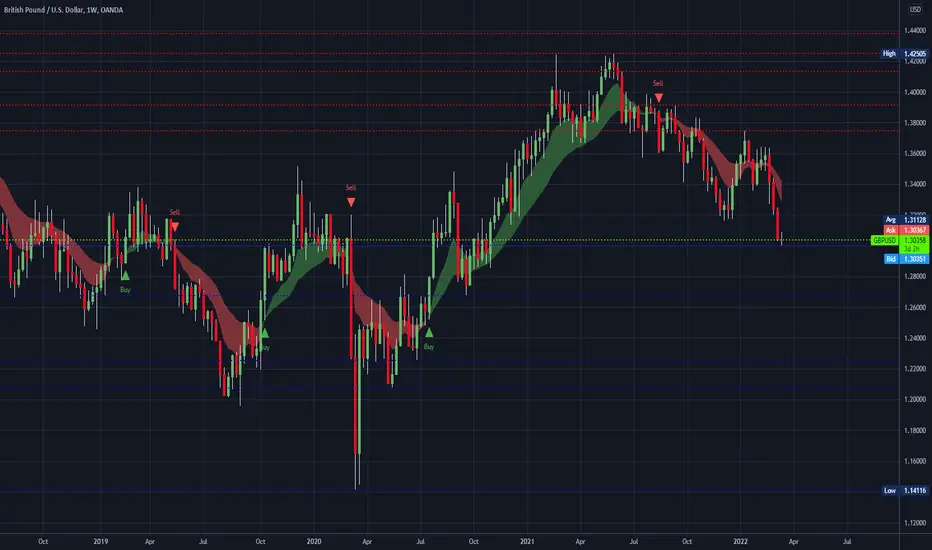
The daily chart reveals that the GBP/USD pair has been in a strong bearish trend in the past few days. The sell-off accelerated when the price moved below the key support level at 1.3160, which was the lowest level this year.
The pair moved below the short and longer moving averages while the Stochastic Oscillator has fallen to the oversold level. Therefore, there is a likelihood that the pair will keep falling as bears target the next key support level at 1.2900.
The pair moved below the short and longer moving averages while the Stochastic Oscillator has fallen to the oversold level. Therefore, there is a likelihood that the pair will keep falling as bears target the next key support level at 1.2900.
Disclaimer
The information and publications are not meant to be, and do not constitute, financial, investment, trading, or other types of advice or recommendations supplied or endorsed by TradingView. Read more in the Terms of Use.
Disclaimer
The information and publications are not meant to be, and do not constitute, financial, investment, trading, or other types of advice or recommendations supplied or endorsed by TradingView. Read more in the Terms of Use.