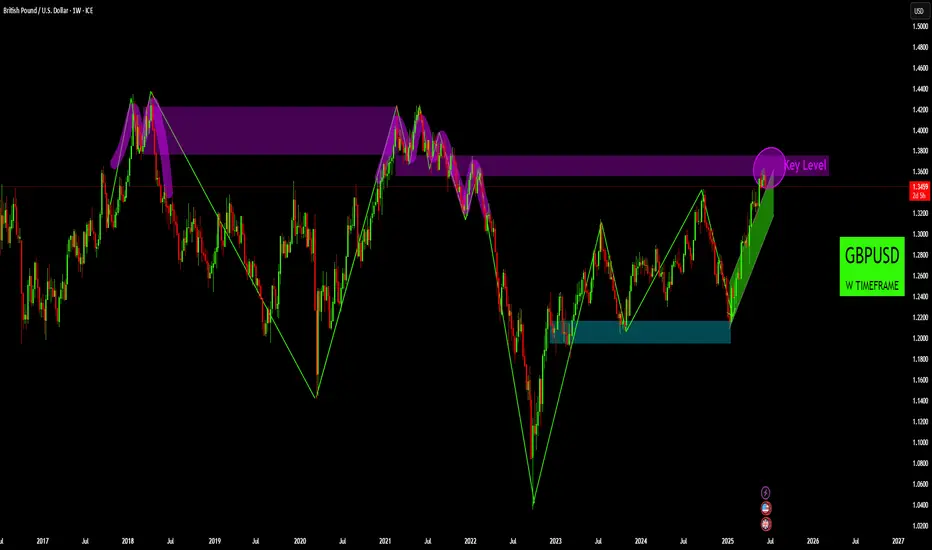
• Long-Term Resistance Zone: The chart displays a significant purple-shaded "Key Level" resistance zone, approximately spanning from 1.3600 to 1.3800. Price has previously reacted to this zone as strong resistance on multiple occasions (e.g., in 2018 and 2021), indicating a historical area of supply. The current price action shows the market testing this zone once again.
• Bullish Market Structure from 2022 Lows: Following a substantial decline through 2022, the GBPUSD pair initiated a strong recovery, characterized by a clear sequence of higher highs and higher lows since late 2022. This upward movement is encapsulated within a robust green ascending trend channel, signifying a dominant bullish bias on this timeframe.
• Identified Support Areas: A notable support zone is evident around the 1.2100-1.2200 levels. This area has historically acted as a strong demand zone, providing significant bounces for the price, most recently in late 2022 and early 2024.
• Current Price at Critical Confluence: Price is currently situated at the upper boundary of its long-term ascending trend channel and is simultaneously interacting with the established "Key Level" resistance zone. This confluence of technical elements suggests a pivotal point for the pair, where a decisive reaction from either buyers or sellers is anticipated.
Disclaimer:
The information provided in this chart is for educational and informational purposes only and should not be considered as investment advice. Trading and investing involve substantial risk and are not suitable for every investor. You should carefully consider your financial situation and consult with a financial advisor before making any investment decisions. The creator of this chart does not guarantee any specific outcome or profit and is not responsible for any losses incurred as a result of using this information. Past performance is not indicative of future results. Use this information at your own risk. This chart has been created for my own improvement in Trading and Investment Analysis. Please do your own analysis before any investments.
Disclaimer
The information and publications are not meant to be, and do not constitute, financial, investment, trading, or other types of advice or recommendations supplied or endorsed by TradingView. Read more in the Terms of Use.
Disclaimer
The information and publications are not meant to be, and do not constitute, financial, investment, trading, or other types of advice or recommendations supplied or endorsed by TradingView. Read more in the Terms of Use.