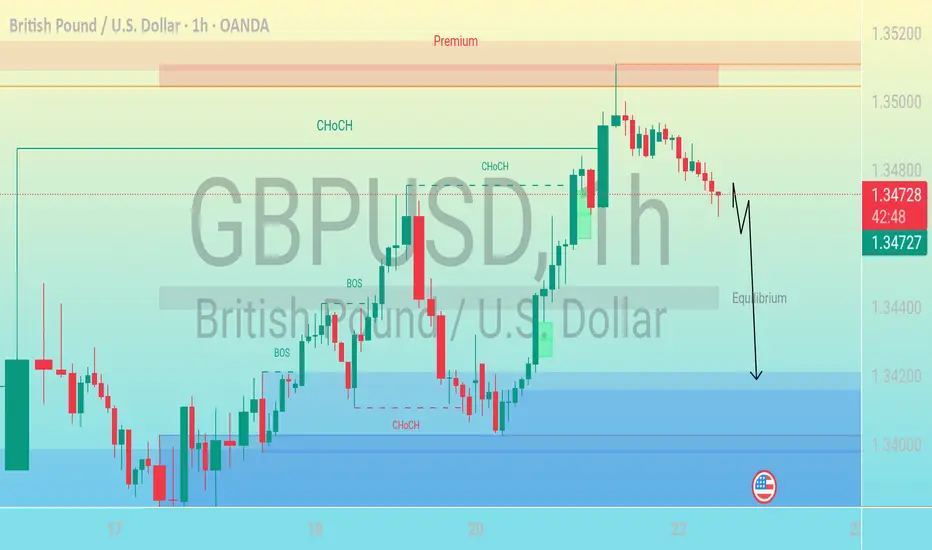
This is a GBP/USD (British Pound / U.S. Dollar) forex trading chart on the 1-hour timeframe, published on TradingView. Let’s break down and describe its key elements:
---
🕒 Timeframe & Pair
Currency Pair: GBP/USD
Timeframe: 1-hour (each candlestick = 1 hour)
Date & Time: July 22, 2025, 06:12 UTC
---
📉 Price Action
Current Price: ~1.34690
The price has recently moved from a premium zone (upper part of the range) and is heading downward.
The red candle at the top shows bearish momentum starting to form after a rally.
---
🔁 Market Structure Labels
CHoCH = Change of Character
Signals a possible reversal or shift in trend (e.g., from bearish to bullish or vice versa).
Several CHoCH points are marked throughout the chart, indicating key shifts.
BOS = Break of Structure
Indicates a significant breach of previous market structure (e.g., support/resistance).
Suggests a trend continuation or momentum confirmation.
---
⚖️ Zones
Premium Zone (Top shaded region):
Price considered overvalued, typically a good area for potential short (sell) positions.
Discount Zone (Bottom shaded region):
Price considered undervalued, potential area for buys.
Equilibrium (Middle horizontal level):
Represents fair value or a midpoint between premium and discount zones.
The price is expected to return here before potentially continuing lower.
---
⬇️ Projected Movement
A downward arrow is drawn from the current price, suggesting:
The analyst expects a pullback to the equilibrium level.
Followed by a further decline into the discount zone around 1.34200 or lower.
---
🇺🇸 News/Event Icon
U.S. flag icon near the expected price drop indicates a potential economic news release or event from the U.S. that could influence the price movement.
---
🕒 Timeframe & Pair
Currency Pair: GBP/USD
Timeframe: 1-hour (each candlestick = 1 hour)
Date & Time: July 22, 2025, 06:12 UTC
---
📉 Price Action
Current Price: ~1.34690
The price has recently moved from a premium zone (upper part of the range) and is heading downward.
The red candle at the top shows bearish momentum starting to form after a rally.
---
🔁 Market Structure Labels
CHoCH = Change of Character
Signals a possible reversal or shift in trend (e.g., from bearish to bullish or vice versa).
Several CHoCH points are marked throughout the chart, indicating key shifts.
BOS = Break of Structure
Indicates a significant breach of previous market structure (e.g., support/resistance).
Suggests a trend continuation or momentum confirmation.
---
⚖️ Zones
Premium Zone (Top shaded region):
Price considered overvalued, typically a good area for potential short (sell) positions.
Discount Zone (Bottom shaded region):
Price considered undervalued, potential area for buys.
Equilibrium (Middle horizontal level):
Represents fair value or a midpoint between premium and discount zones.
The price is expected to return here before potentially continuing lower.
---
⬇️ Projected Movement
A downward arrow is drawn from the current price, suggesting:
The analyst expects a pullback to the equilibrium level.
Followed by a further decline into the discount zone around 1.34200 or lower.
---
🇺🇸 News/Event Icon
U.S. flag icon near the expected price drop indicates a potential economic news release or event from the U.S. that could influence the price movement.
10 years experience in trading
BTC Eurusd xauusd pairs trades available ✅
Related publications
Disclaimer
The information and publications are not meant to be, and do not constitute, financial, investment, trading, or other types of advice or recommendations supplied or endorsed by TradingView. Read more in the Terms of Use.