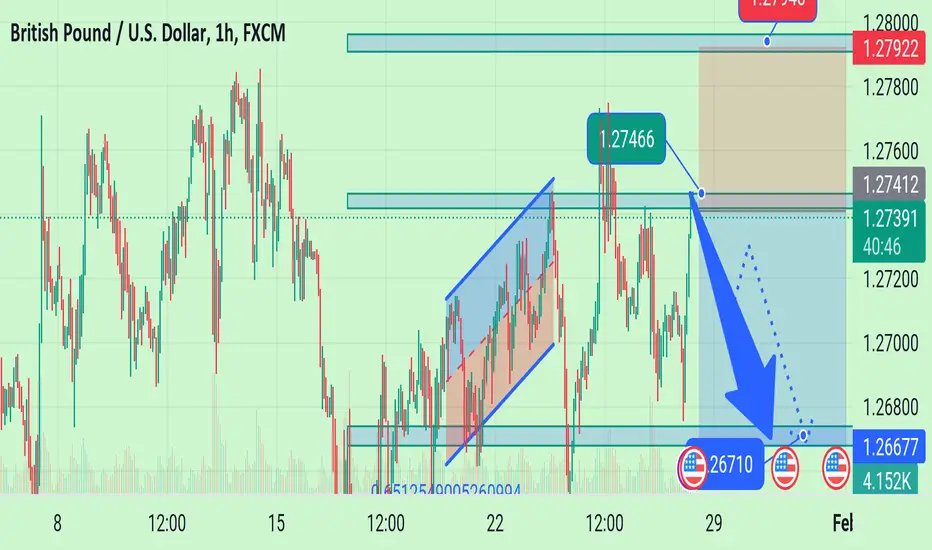
Today GBPUSD sell move today confirm chart don't miss this chart
The 200-period Simple Moving Average (SMA) on the four-hour chart aligns as a pivot level at 1.2700. If GBP/USD continues to use that level as resistance, technical sellers could remain interested. In this scenario, 1.2650 (Fibonacci 23.6% retracement of the October-December uptrend) and 1.2600 (psychological level, static level) could be seen as next bearish targets.
On the upside, resistances could be at 1.2760 (static level) and 1.2780 (static level) in case GBP/USD stabilizes above 1.2700.
GBPUSD SELL NOW. 127446
CONFIRM TARGET 126710
On the upside, resistances could be at 1.2760 (static level) and 1.2780 (static level) in case GBP/USD stabilizes above 1.2700.
GBPUSD SELL NOW. 127446
CONFIRM TARGET 126710
Note
10 pips running trade Profit start 🔥🔥Note
40 pips done ✅Note
Guy's support meNote
50 pips runningNote
Target SuccessfullyNote
Enjoy profit guysNote
Join my telegram channelDisclaimer
The information and publications are not meant to be, and do not constitute, financial, investment, trading, or other types of advice or recommendations supplied or endorsed by TradingView. Read more in the Terms of Use.
Disclaimer
The information and publications are not meant to be, and do not constitute, financial, investment, trading, or other types of advice or recommendations supplied or endorsed by TradingView. Read more in the Terms of Use.