Analysis of GBP/USD 1-Hour Chart Signaling Bullish Trend 📈
I. Support Levels & Chart Patterns
Support Confirmation
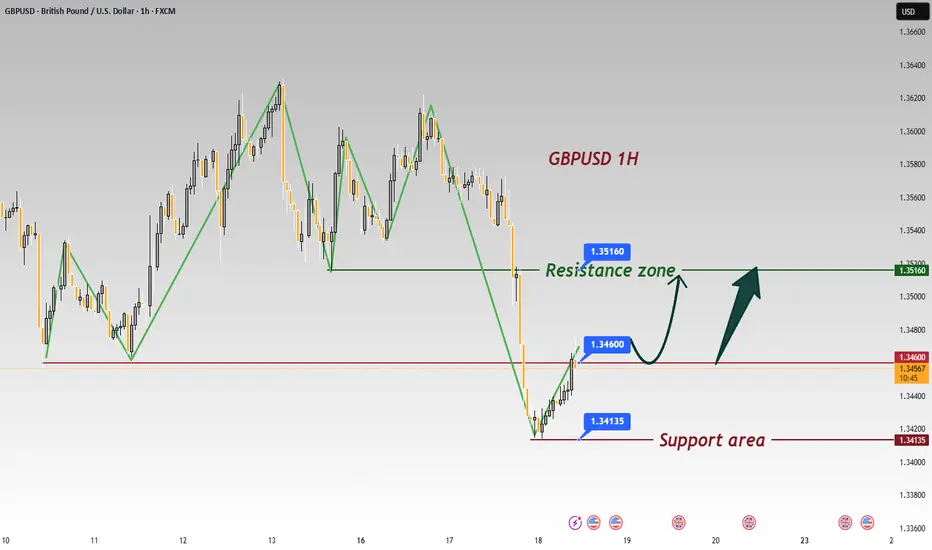
After testing the 1.34135 support zone, price rebounded sharply with consecutive bullish candles 🚀, forming a potential "double bottom" pattern (or wave low). This successful defense of support reinforces the foundation for upward movement 🏗️.
Resistance Breakout Potential
Price is currently advancing from the 1.34600 short-term support. The key resistance lies at 1.35160. A decisive breakout above this level would validate the bullish projection indicated by the upward arrows on the chart 🎯
⚡️⚡️⚡️ GBPUSD ⚡️⚡️⚡️
🚀 Buy@ 1.33500 - 1.34000
🚀 TP 1.35000 - 1.35500
Accurate signals are updated every day 📈 If you encounter any problems during trading, these signals can serve as your reliable guide 🧭 Feel free to refer to them! I sincerely hope they'll be of great help to you 🌟 👇
I. Support Levels & Chart Patterns
Support Confirmation
After testing the 1.34135 support zone, price rebounded sharply with consecutive bullish candles 🚀, forming a potential "double bottom" pattern (or wave low). This successful defense of support reinforces the foundation for upward movement 🏗️.
Resistance Breakout Potential
Price is currently advancing from the 1.34600 short-term support. The key resistance lies at 1.35160. A decisive breakout above this level would validate the bullish projection indicated by the upward arrows on the chart 🎯
⚡️⚡️⚡️ GBPUSD ⚡️⚡️⚡️
🚀 Buy@ 1.33500 - 1.34000
🚀 TP 1.35000 - 1.35500
Accurate signals are updated every day 📈 If you encounter any problems during trading, these signals can serve as your reliable guide 🧭 Feel free to refer to them! I sincerely hope they'll be of great help to you 🌟 👇
Trade active
I think the Fed's interest rate decision this time may cause GBPUSD to directly break through 1.13500Disclaimer
The information and publications are not meant to be, and do not constitute, financial, investment, trading, or other types of advice or recommendations supplied or endorsed by TradingView. Read more in the Terms of Use.
Disclaimer
The information and publications are not meant to be, and do not constitute, financial, investment, trading, or other types of advice or recommendations supplied or endorsed by TradingView. Read more in the Terms of Use.