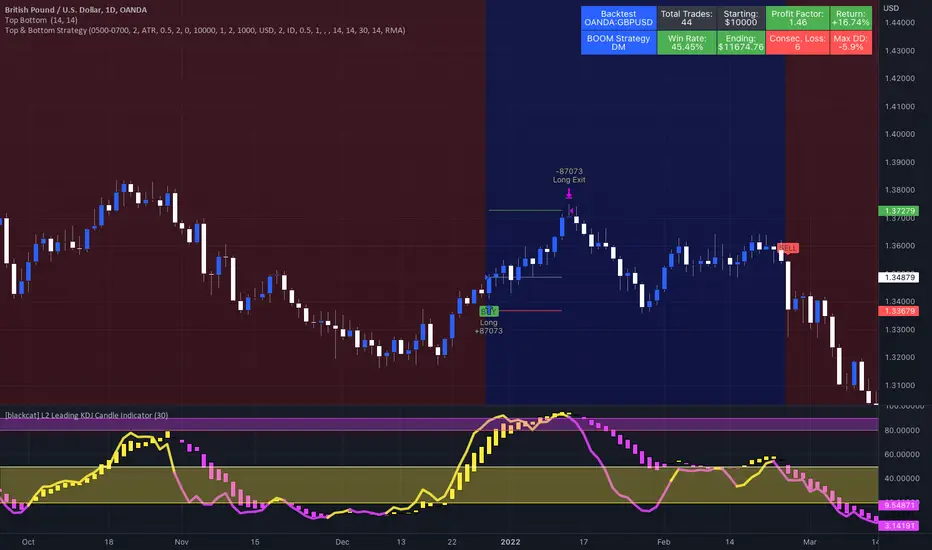
Simple Top & Bottom Indicator with confluence of the KDJ Indicator!
Long Entry Example:
-Background Switched from red to blue
-Buy Label Printed
-KDJ close above 50
Short Entry Example
-Background Switched from blue to red
-Sell Label Printed
-KDJ close below 50
SL Placement:
-Last Bullish/Bearish Candle of previous opposite chart background.
Risk to Reward:
1:2 (recommended)
1.1.5 (higher Winrate)
I coded it into a Strategy.
Suitable for the 1min Chart.
Note
16% Gain on Account -> see Strategy Dashboard Top Right(based on 1% Risk per Trade)
Note
SL Placement: ATR, Swing High's/Low's, S/R-Level's is possible as wellDisclaimer
The information and publications are not meant to be, and do not constitute, financial, investment, trading, or other types of advice or recommendations supplied or endorsed by TradingView. Read more in the Terms of Use.
Disclaimer
The information and publications are not meant to be, and do not constitute, financial, investment, trading, or other types of advice or recommendations supplied or endorsed by TradingView. Read more in the Terms of Use.