🧠 Disruptive Analysis:
🔴 1. False Breakout Potential
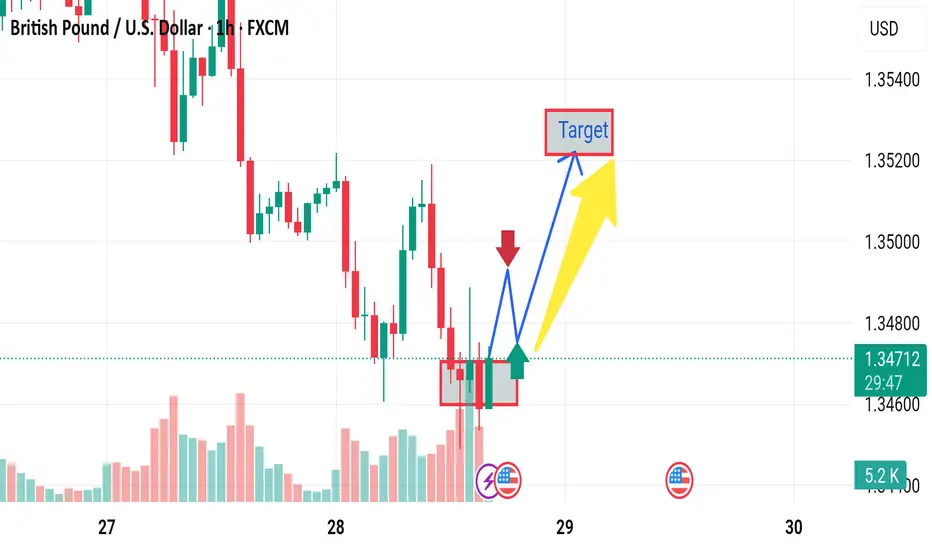
The marked box shows a consolidation zone. While the green candle breaks slightly above it, this might be a trap (false breakout). If there's no strong follow-through, price may sharply retest or drop back inside the box—a classic bull trap.
🔴 2. Bearish Volume Profile
Volume spiked on the initial drop, and even though there's some green candle volume, it’s not convincingly higher than previous bars. This could imply weak buyer commitment at this level, suggesting a potential reversal downward.
🔴 3. Overhead Resistance
Even if price breaks out, it faces immediate resistance around 1.3485–1.3500, where multiple wicks formed earlier. This could stall or reject the move, invalidating the bullish "Target."
🔴 4. Economic Risk
The U.S. economic event icons below suggest incoming USD-related news. If the data is USD-positive (e.g., strong employment or inflation), it could strengthen the dollar and push GBP/USD lower, negating the bullish move entirely.
🔴 1. False Breakout Potential
The marked box shows a consolidation zone. While the green candle breaks slightly above it, this might be a trap (false breakout). If there's no strong follow-through, price may sharply retest or drop back inside the box—a classic bull trap.
🔴 2. Bearish Volume Profile
Volume spiked on the initial drop, and even though there's some green candle volume, it’s not convincingly higher than previous bars. This could imply weak buyer commitment at this level, suggesting a potential reversal downward.
🔴 3. Overhead Resistance
Even if price breaks out, it faces immediate resistance around 1.3485–1.3500, where multiple wicks formed earlier. This could stall or reject the move, invalidating the bullish "Target."
🔴 4. Economic Risk
The U.S. economic event icons below suggest incoming USD-related news. If the data is USD-positive (e.g., strong employment or inflation), it could strengthen the dollar and push GBP/USD lower, negating the bullish move entirely.
t.me/gold_free_signals1
𝙁𝙤𝙧𝙚𝙭 𝙩𝙧𝙖𝙙𝙞𝙣𝙜 𝙚𝙭𝙥𝙚𝙧𝙞𝙚𝙣𝙘𝙚 𝙩𝙚𝙖𝙢 ☺️ 𝙢𝙖𝙣𝙖𝙜𝙚 𝙮𝙤𝙪𝙧 𝙖𝙘𝙘𝙤𝙪𝙣𝙩 𝙢𝙖𝙠𝙞𝙣𝙜 𝙢𝙤𝙣𝙚𝙮 🤑💰
t.me/gold_free_signals1
𝙁𝙤𝙧𝙚𝙭 𝙩𝙧𝙖𝙙𝙞𝙣𝙜 𝙚𝙭𝙥𝙚𝙧𝙞𝙚𝙣𝙘𝙚 𝙩𝙚𝙖𝙢 ☺️ 𝙢𝙖𝙣𝙖𝙜𝙚 𝙮𝙤𝙪𝙧 𝙖𝙘𝙘𝙤𝙪𝙣𝙩 𝙢𝙖𝙠𝙞𝙣𝙜 𝙢𝙤𝙣𝙚𝙮 🤑💰
t.me/gold_free_signals1
Disclaimer
The information and publications are not meant to be, and do not constitute, financial, investment, trading, or other types of advice or recommendations supplied or endorsed by TradingView. Read more in the Terms of Use.
t.me/gold_free_signals1
𝙁𝙤𝙧𝙚𝙭 𝙩𝙧𝙖𝙙𝙞𝙣𝙜 𝙚𝙭𝙥𝙚𝙧𝙞𝙚𝙣𝙘𝙚 𝙩𝙚𝙖𝙢 ☺️ 𝙢𝙖𝙣𝙖𝙜𝙚 𝙮𝙤𝙪𝙧 𝙖𝙘𝙘𝙤𝙪𝙣𝙩 𝙢𝙖𝙠𝙞𝙣𝙜 𝙢𝙤𝙣𝙚𝙮 🤑💰
t.me/gold_free_signals1
𝙁𝙤𝙧𝙚𝙭 𝙩𝙧𝙖𝙙𝙞𝙣𝙜 𝙚𝙭𝙥𝙚𝙧𝙞𝙚𝙣𝙘𝙚 𝙩𝙚𝙖𝙢 ☺️ 𝙢𝙖𝙣𝙖𝙜𝙚 𝙮𝙤𝙪𝙧 𝙖𝙘𝙘𝙤𝙪𝙣𝙩 𝙢𝙖𝙠𝙞𝙣𝙜 𝙢𝙤𝙣𝙚𝙮 🤑💰
t.me/gold_free_signals1
Disclaimer
The information and publications are not meant to be, and do not constitute, financial, investment, trading, or other types of advice or recommendations supplied or endorsed by TradingView. Read more in the Terms of Use.