Gbpusd sell now today confirm move is sell guy's don't miss this
GBP/USD pierced through 1.2700, where the 50-, 100- and 200-period Simple Moving Averages (SMA) on the 4-hour chart are located, and closed the last 4 4-hour candles above that level. Meanwhile, the Relative Strength Index (RSI) indicator rose to 60, confirming the bullish tilt in the short-term outlook.
On the upside, 1.2780 (static level) aligns as interim resistance before 1.2820 (end-point of the latest uptrend) and 1.2860 (static level from July). Strong support is located at 1.2700 before 1.2650 (Fibonacci 23.6% retracement).
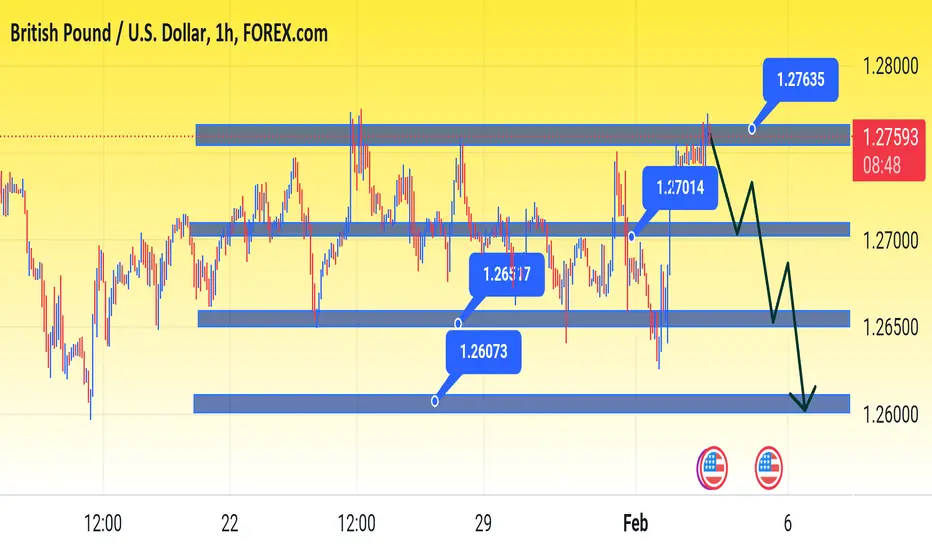
Gbpusd sell now 1.27635
Confirm Target 1.26073
On the upside, 1.2780 (static level) aligns as interim resistance before 1.2820 (end-point of the latest uptrend) and 1.2860 (static level from July). Strong support is located at 1.2700 before 1.2650 (Fibonacci 23.6% retracement).
Gbpusd sell now 1.27635
Confirm Target 1.26073
Trade active
Running trade Profit start 🔥🔥Note
Enjoy your profit guysNote
30 pips doneNote
Enjoy your profitNote
Guy's support meNote
60 pips doneNote
80 pips runningNote
Please support me join my channelTrade active
100 pips runningNote
Guy's I need your supportNote
150 pips doneNote
Target SuccessfullyNote
Guy's support meNote
Guy's support meNote
I need your support please support meNote
Guy's see this analysisNote
Target SuccessfullyDisclaimer
The information and publications are not meant to be, and do not constitute, financial, investment, trading, or other types of advice or recommendations supplied or endorsed by TradingView. Read more in the Terms of Use.
Disclaimer
The information and publications are not meant to be, and do not constitute, financial, investment, trading, or other types of advice or recommendations supplied or endorsed by TradingView. Read more in the Terms of Use.