📊 Weekly Chart: Long shadow at support, prior resistance.
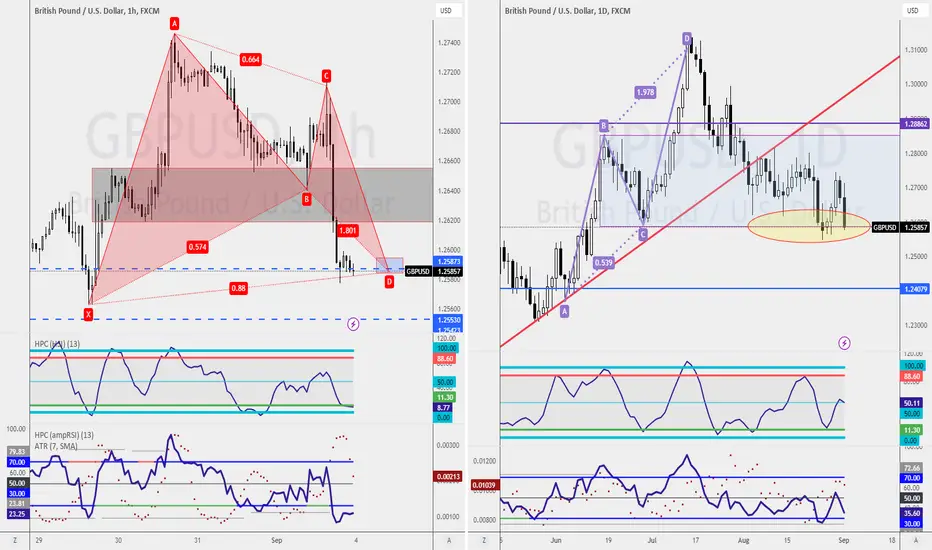
📈 Daily Chart: ABCD pattern, respecting support.
🕓 Four Hour Chart: Counter-trend trade possibility.
⏳ One Hour Chart: Bullish bat pattern, wait for confirmation.
🌟 Weekly Chart Insight:
- Market stands still in buy zone.
- Different from Eurodollar.
📊 Daily Chart:
- ABCD pattern, support respected.
- Previous trade resulted in 219 pips gain.
💡 Trading Opportunities:
- Confirmation of support for a buy.
- Counter-trend trade in the sell zone.
🦇 One Hour Chart:
- Bullish bat pattern.
- Wait for consolidation or double bottom.
- Use RSI Divergence for confirmation.
🕒 15mins workday for Young Parents
🏦 Qualify Junior Analyst within 90days
🎤 Keynote Speaker
Get into our 15mins workday community
discord.gg/AKDr9vPqH7
Live session & Trading Tips on the GO
instagram.com/raynlim/
🏦 Qualify Junior Analyst within 90days
🎤 Keynote Speaker
Get into our 15mins workday community
discord.gg/AKDr9vPqH7
Live session & Trading Tips on the GO
instagram.com/raynlim/
Disclaimer
The information and publications are not meant to be, and do not constitute, financial, investment, trading, or other types of advice or recommendations supplied or endorsed by TradingView. Read more in the Terms of Use.