As prices went higher than expected, I started to manually close out all my positions. It was hard and at first it made me lose sight of the main goal here.
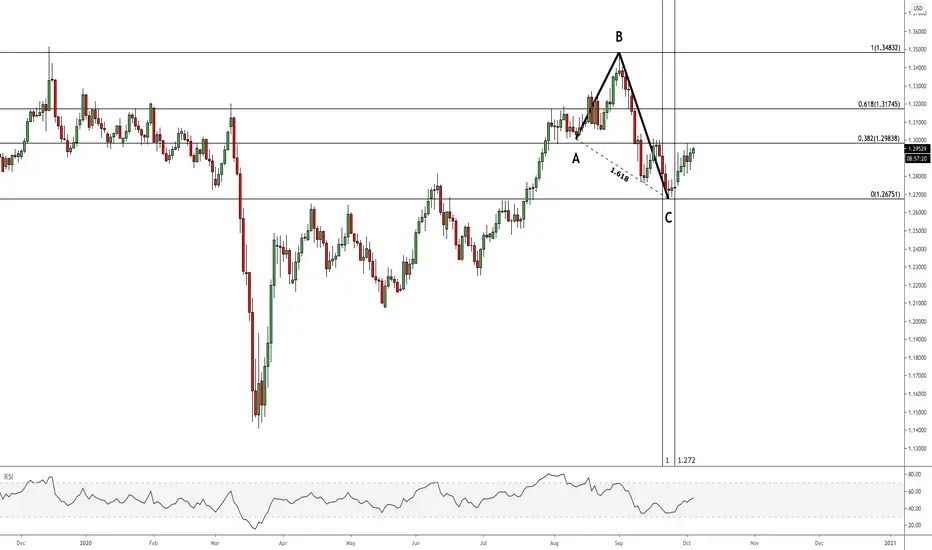
What you see on this chart here folks is a golden triangle.
Did you know, if you take the length of any sides of the pyramids in Giza, it will always be 1.618 in relation to the half of its base length?
If you raise your arm and stretch it above your head, your very own body will then be made up of 3 golden triangles.
In a pentagon, what you have is actually 5 golden triangles, and in the middle you have another pentagon. You can keep on drawing pentagons within and you will have 5 golden triangles in each of them. This goes on into infinity, just like the Fibonacci sequence.
Good luck to everyone trading GBP/USD!!
Note
Note
Note
The one minute chart looks like the beginning of a new uptrend with a full wave completion:Note
Any Elliot wave specialist out there willing to comment on the chart above?Note
0.382 target hitNote
CHANGING BIAS AS THE DARK CLOUD COVER CANDLESTICK PATTERN APPEARS AT THE 0.382Related publications
Disclaimer
The information and publications are not meant to be, and do not constitute, financial, investment, trading, or other types of advice or recommendations supplied or endorsed by TradingView. Read more in the Terms of Use.
Related publications
Disclaimer
The information and publications are not meant to be, and do not constitute, financial, investment, trading, or other types of advice or recommendations supplied or endorsed by TradingView. Read more in the Terms of Use.