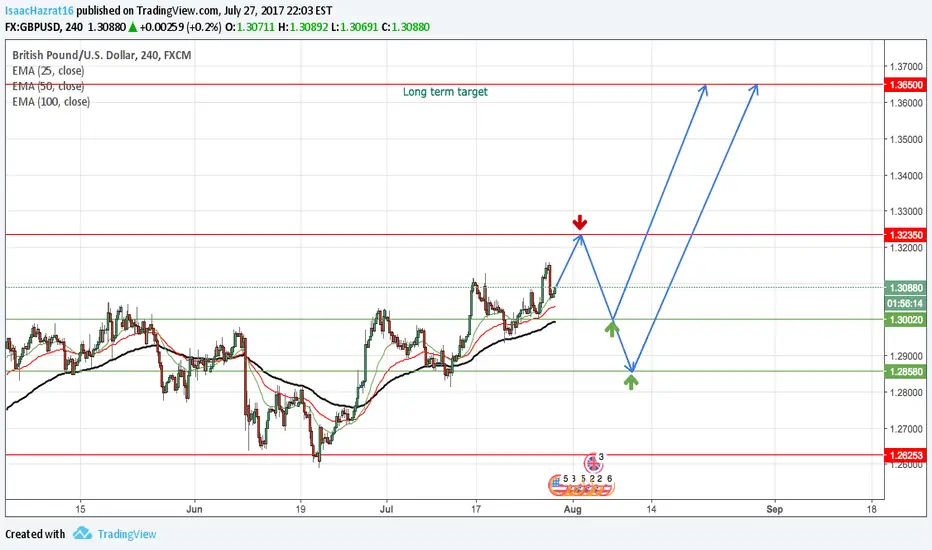
Guys, I am mapping a movement for GBPUSD. My long term direction will be bullish. I am experimenting with new mapping style in lower timeframe, thus this chart emerges. Lets see if this experimental fibonacci sequence was a success or not. Please do not follow the analysis. I post it for my future reference only and it was still in experimental process. Thanks
Trade active
Look for chance to place short order. Take 1st Profit at 1.3Trade closed: target reached
Short order target reachedTrade active
Start buying at 1.298 - 1.2858 areaDisclaimer
The information and publications are not meant to be, and do not constitute, financial, investment, trading, or other types of advice or recommendations supplied or endorsed by TradingView. Read more in the Terms of Use.
Disclaimer
The information and publications are not meant to be, and do not constitute, financial, investment, trading, or other types of advice or recommendations supplied or endorsed by TradingView. Read more in the Terms of Use.