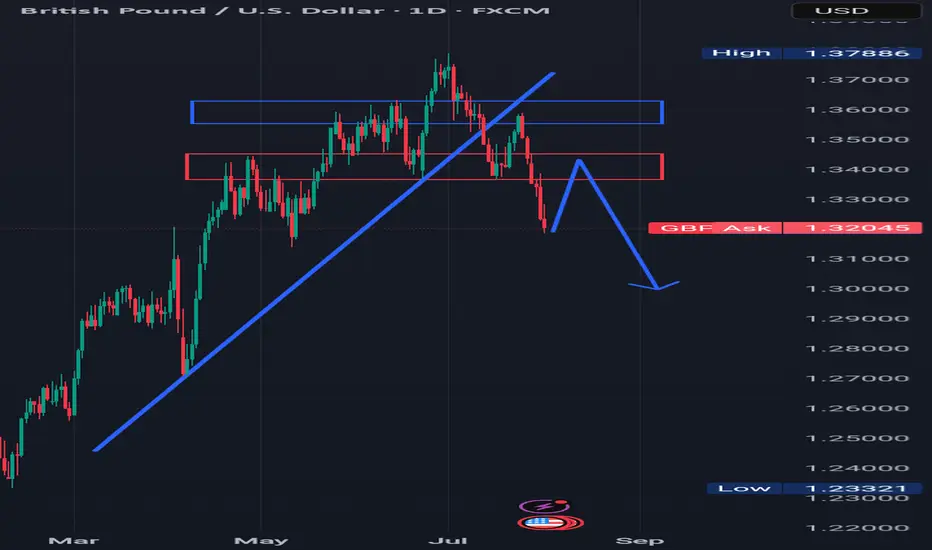
Looking at the GBPUSD pair, we can see that the trend has reversed to the downside.
The pair broke a rising trendline to the downside in the past and also formed a head and shoulder pattern.
Also in the past,price broke a resistance which is indicated with blue rectangle and a support which is indicated with a red rectangle to the downside.
I'm seeing price retracing to retest the previously broken structure or support which is indicated with a red rectangle and turning it to resistance, and thereby continuing the downtrend
Disclaimer
The information and publications are not meant to be, and do not constitute, financial, investment, trading, or other types of advice or recommendations supplied or endorsed by TradingView. Read more in the Terms of Use.
Disclaimer
The information and publications are not meant to be, and do not constitute, financial, investment, trading, or other types of advice or recommendations supplied or endorsed by TradingView. Read more in the Terms of Use.