GBP/USD Bearish Trend Analysis
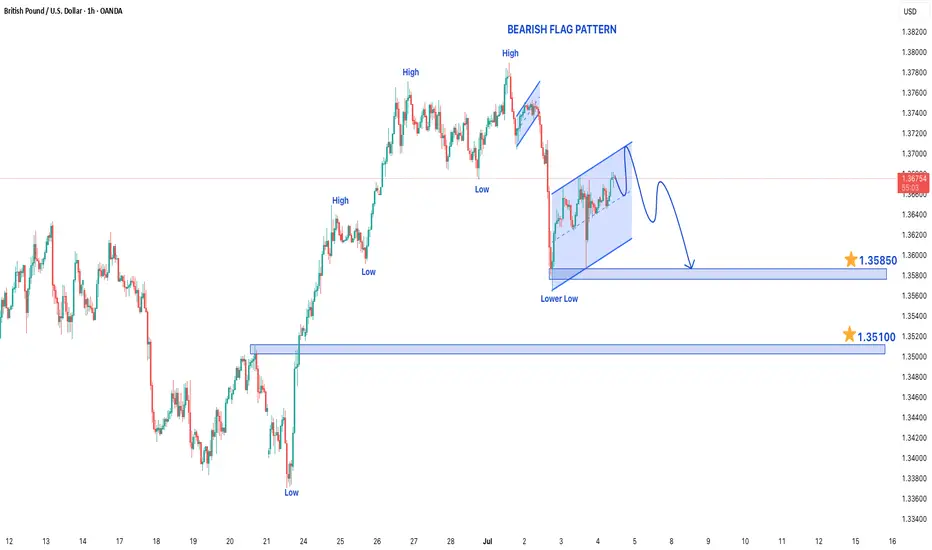
The GBP/USD pair is currently exhibiting a bearish trend on the 1-hour chart, with the market forming lower lows, a clear indication of sustained selling pressure. This downward momentum suggests that traders are favoring short positions, and the bearish sentiment may continue in the upcoming trading sessions.
Bearish Flag Pattern Suggests Further Downside
Adding to the bearish outlook, the price action is forming a bearish flag pattern, which is typically a continuation signal in a downtrend. This pattern consists of a sharp decline (the flagpole) followed by a slight upward or sideways consolidation (the flag). A breakdown below the flag’s support could trigger another wave of selling, reinforcing the bearish bias.
Key Support Levels to Watch
If the downtrend continues, the market could target the following support levels:
- 1.35850 – The initial downside target, likely to act as a short-term support zone.
- 1.35100 – A deeper support level that may come into play if selling pressure intensifies.
A break below these levels could open the door for further declines, potentially extending toward 1.34500 or lower, depending on market momentum.
Resistance Level as a Key Barrier
On the upside, the 1.37900 level serves as a critical resistance. If the price retraces higher, this zone could act as a strong barrier where sellers might re-enter. A sustained break above this resistance could invalidate the bearish outlook, signaling a potential trend reversal or consolidation phase.
Trading Strategy Considerations
- Bearish Scenario: Traders may look for short opportunities near resistance levels or upon a confirmed breakdown below the bearish flag.
- Risk Management: A stop-loss above 1.37900 (or a recent swing high) could help mitigate risk if the market reverses unexpectedly.
- Bullish Caution: If GBP/USD breaks above 1.37900 with strong momentum, the bearish thesis may need reevaluation.
Conclusion
The GBP/USD pair remains bearish in the short term, supported by the lower lows and the bearish flag pattern. Traders should monitor the 1.35850 and 1.35100 support levels for potential downside targets, while keeping an eye on 1.37900 as a key resistance that could determine whether the downtrend continues or reverses. Proper risk management remains essential in navigating this market structure.
Trade closed: target reached
Disclaimer
The information and publications are not meant to be, and do not constitute, financial, investment, trading, or other types of advice or recommendations supplied or endorsed by TradingView. Read more in the Terms of Use.
Disclaimer
The information and publications are not meant to be, and do not constitute, financial, investment, trading, or other types of advice or recommendations supplied or endorsed by TradingView. Read more in the Terms of Use.