🧨 Disruption Points:
1. Bullish Accumulation Underway
The recent candles show higher lows and lower volume on red candles, suggesting selling pressure is decreasing.
> Disruptive scenario: Price may bounce off minor support (around 1.3560–1.3570) and form a higher low, triggering a bullish rally back above 1.3620.
---
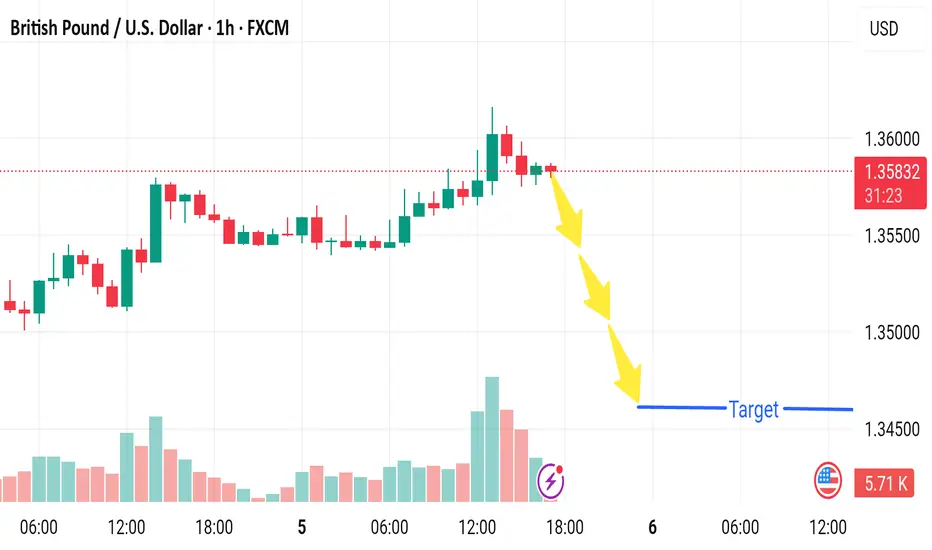
2. Fake Bearish Setup (Liquidity Trap)
The three arrows predicting a drop might represent a classic retail trap where too many anticipate the same direction.
> Contrary idea: A false breakdown below 1.3550 may occur just to collect stop-losses, followed by a strong reversal upward.
---
3. Divergence Risk
If momentum indicators (e.g., RSI, MACD) show bullish divergence while price moves sideways or dips, it may signal an upcoming bullish impulse.
> Disruption: Downward arrows may be misinterpreting consolidation as weakness rather than a setup for continuation of the previous uptrend.
---
4. Fundamental Wildcard
The chart shows an upcoming U.S. economic event, likely to impact the dollar.
If the data is weak for the USD, GBP/USD could surge sharply, invalidating the bearish scenario.
1. Bullish Accumulation Underway
The recent candles show higher lows and lower volume on red candles, suggesting selling pressure is decreasing.
> Disruptive scenario: Price may bounce off minor support (around 1.3560–1.3570) and form a higher low, triggering a bullish rally back above 1.3620.
---
2. Fake Bearish Setup (Liquidity Trap)
The three arrows predicting a drop might represent a classic retail trap where too many anticipate the same direction.
> Contrary idea: A false breakdown below 1.3550 may occur just to collect stop-losses, followed by a strong reversal upward.
---
3. Divergence Risk
If momentum indicators (e.g., RSI, MACD) show bullish divergence while price moves sideways or dips, it may signal an upcoming bullish impulse.
> Disruption: Downward arrows may be misinterpreting consolidation as weakness rather than a setup for continuation of the previous uptrend.
---
4. Fundamental Wildcard
The chart shows an upcoming U.S. economic event, likely to impact the dollar.
If the data is weak for the USD, GBP/USD could surge sharply, invalidating the bearish scenario.
t.me/gold_free_signals1
𝙁𝙤𝙧𝙚𝙭 𝙩𝙧𝙖𝙙𝙞𝙣𝙜 𝙚𝙭𝙥𝙚𝙧𝙞𝙚𝙣𝙘𝙚 𝙩𝙚𝙖𝙢 ☺️ 𝙢𝙖𝙣𝙖𝙜𝙚 𝙮𝙤𝙪𝙧 𝙖𝙘𝙘𝙤𝙪𝙣𝙩 𝙢𝙖𝙠𝙞𝙣𝙜 𝙢𝙤𝙣𝙚𝙮 🤑💰
t.me/gold_free_signals1
𝙁𝙤𝙧𝙚𝙭 𝙩𝙧𝙖𝙙𝙞𝙣𝙜 𝙚𝙭𝙥𝙚𝙧𝙞𝙚𝙣𝙘𝙚 𝙩𝙚𝙖𝙢 ☺️ 𝙢𝙖𝙣𝙖𝙜𝙚 𝙮𝙤𝙪𝙧 𝙖𝙘𝙘𝙤𝙪𝙣𝙩 𝙢𝙖𝙠𝙞𝙣𝙜 𝙢𝙤𝙣𝙚𝙮 🤑💰
t.me/gold_free_signals1
Disclaimer
The information and publications are not meant to be, and do not constitute, financial, investment, trading, or other types of advice or recommendations supplied or endorsed by TradingView. Read more in the Terms of Use.
t.me/gold_free_signals1
𝙁𝙤𝙧𝙚𝙭 𝙩𝙧𝙖𝙙𝙞𝙣𝙜 𝙚𝙭𝙥𝙚𝙧𝙞𝙚𝙣𝙘𝙚 𝙩𝙚𝙖𝙢 ☺️ 𝙢𝙖𝙣𝙖𝙜𝙚 𝙮𝙤𝙪𝙧 𝙖𝙘𝙘𝙤𝙪𝙣𝙩 𝙢𝙖𝙠𝙞𝙣𝙜 𝙢𝙤𝙣𝙚𝙮 🤑💰
t.me/gold_free_signals1
𝙁𝙤𝙧𝙚𝙭 𝙩𝙧𝙖𝙙𝙞𝙣𝙜 𝙚𝙭𝙥𝙚𝙧𝙞𝙚𝙣𝙘𝙚 𝙩𝙚𝙖𝙢 ☺️ 𝙢𝙖𝙣𝙖𝙜𝙚 𝙮𝙤𝙪𝙧 𝙖𝙘𝙘𝙤𝙪𝙣𝙩 𝙢𝙖𝙠𝙞𝙣𝙜 𝙢𝙤𝙣𝙚𝙮 🤑💰
t.me/gold_free_signals1
Disclaimer
The information and publications are not meant to be, and do not constitute, financial, investment, trading, or other types of advice or recommendations supplied or endorsed by TradingView. Read more in the Terms of Use.