GBP/USD holds comfortably above the ascending trend line and the 200-period and the 100-period Simple Moving Averages (SMA), reflecting the bullish bias. Additionally, the Relative Strength Index (RSI) indicator on the 4-hour chart stays above 50.
In case GBP/USD confirms 1.2450 (Fibonacci 50% retracement of the latest downtrend) as support, it could target 1.2500 (round level, static level) and 1.2530 (Fibonacci 61.8% retracement) next. On the downside, supports could be seen at 1.2415 (100-period SMA) and 1.2380-1.2370 (200-period SMA, Fibonacci 38.2% retracement, ascending trend line).
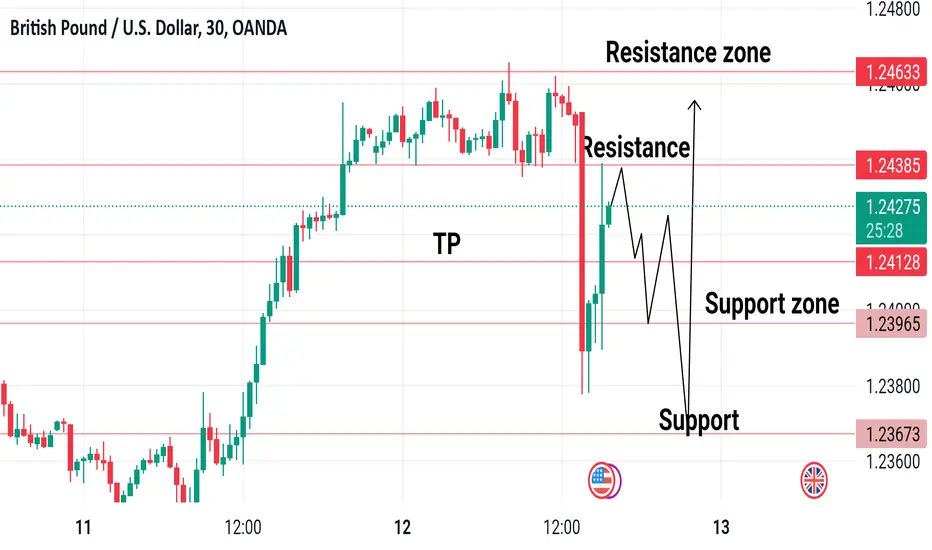
Gbpusd signal
In case GBP/USD confirms 1.2450 (Fibonacci 50% retracement of the latest downtrend) as support, it could target 1.2500 (round level, static level) and 1.2530 (Fibonacci 61.8% retracement) next. On the downside, supports could be seen at 1.2415 (100-period SMA) and 1.2380-1.2370 (200-period SMA, Fibonacci 38.2% retracement, ascending trend line).
Gbpusd signal
Gold signal
t.me/ProTrader_9
My Channel Link
t.me/ProTrader_9
Check My Performance
t.me/ProTrader_9
My Channel Link
t.me/ProTrader_9
Check My Performance
Disclaimer
The information and publications are not meant to be, and do not constitute, financial, investment, trading, or other types of advice or recommendations supplied or endorsed by TradingView. Read more in the Terms of Use.