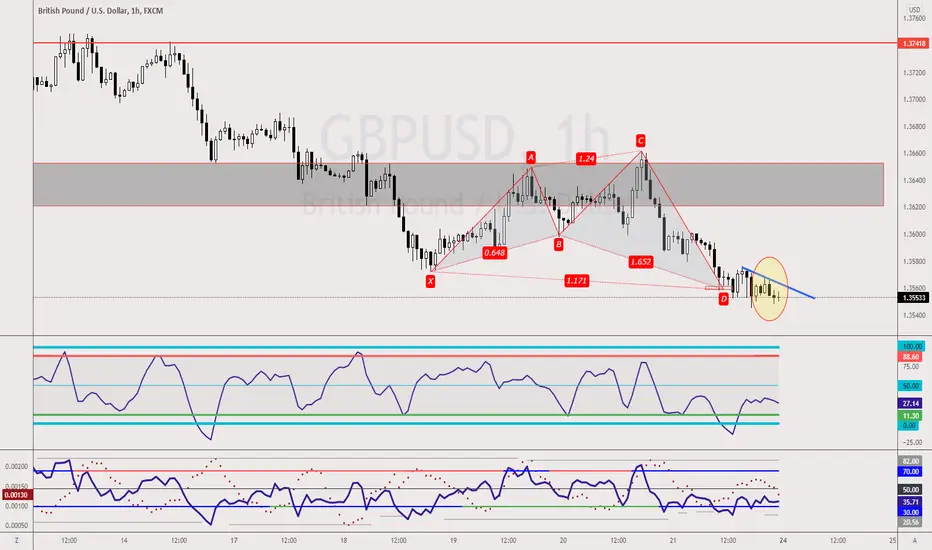
We are already in this trade. The 1-hourly chart Bullish Shark Pattern, check the link within the TradingView for more insights on this trade. But if I were you, I will wait for a break and close above of the blue trendline that was highlighted in the chart, that will give further assurance on the trade, but you will have to trade it off with the better entry price you are getting at this moment and the RSI has a RSI Divergence at this moment, but I were you, I will be waiting and that is because there is a Bullish Butterfly Pattern that complete at a lower price at its 4-hourly chart.
To be honest, even within the Butterfly Pattern in the 4-hourly chart. It is definitely a good idea to have one more filter checked off.
What would it be like for you?
1. Engage Now
2. Wait for candle break and close above the trendline
3. Wait for Bullish Butterfly on the 4-hourly chart.
Comment down below.
🕒 15mins workday for Young Parents
🏦 Qualify Junior Analyst within 90days
🎤 Keynote Speaker
Get into our 15mins workday community
discord.gg/AKDr9vPqH7
Live session & Trading Tips on the GO
instagram.com/raynlim/
🏦 Qualify Junior Analyst within 90days
🎤 Keynote Speaker
Get into our 15mins workday community
discord.gg/AKDr9vPqH7
Live session & Trading Tips on the GO
instagram.com/raynlim/
Related publications
Disclaimer
The information and publications are not meant to be, and do not constitute, financial, investment, trading, or other types of advice or recommendations supplied or endorsed by TradingView. Read more in the Terms of Use.