Hi Traders!
The market is in a Longterm Downtrend (weekly).
This time, instead of beginning with the daily timeframe, we'll begin with the weekly timeframe.
Here is it:

Here you can see three main areas, which affects the market bearish:
The market is in a Longterm Downtrend (weekly).
This time, instead of beginning with the daily timeframe, we'll begin with the weekly timeframe.
Here is it:
Here you can see three main areas, which affects the market bearish:
- The weekly Resistance,
- the weekly descending Trendline and
- the 200 Exponential Moving Average.
]/list}
You see, there are many things which come together at this moment.
Now we move to the Daily:
We want to show you something, that's why the chart is zoomed in.
The price broke out of the weekly Trendline with one green candle.
The next candle closed bearish and even below the low of the previous candle.
You call this Pattern the "Engulfing Pattern" and the situation is called "False Break Setup".
Let's move further to the H4-Timeframe:
Here you can see the market is in a sidewards market.
At this moment it reaches the orange Supply and Demand Area.
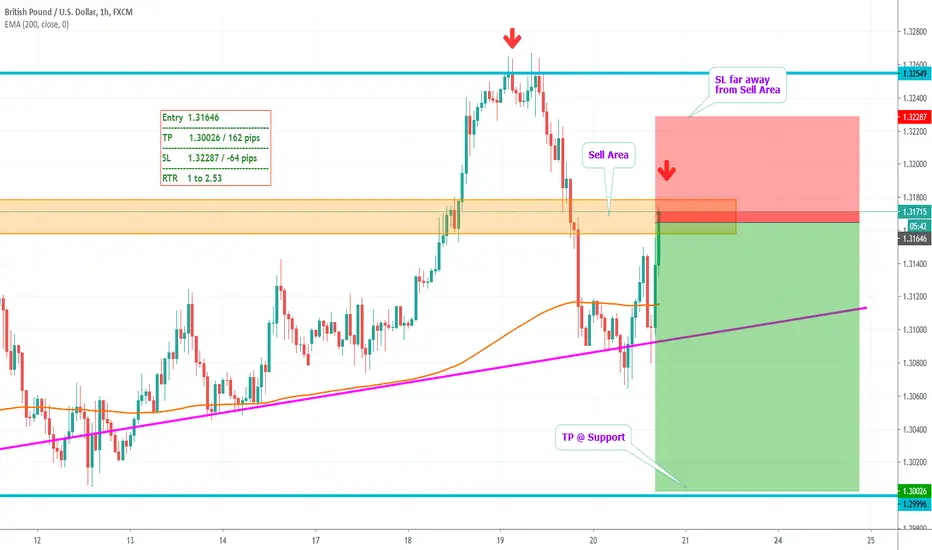
Finally, we move to the Entry Timeframe:
It reaches the orange Sell Area.
The SL is far away from it and the Take Profit is at the next Support.
We recommend to trade the market with a confirmation.Thanks and successful Trading :)!
Note
Here is the RED BOX for you all :)!Note
Disclaimer
The information and publications are not meant to be, and do not constitute, financial, investment, trading, or other types of advice or recommendations supplied or endorsed by TradingView. Read more in the Terms of Use.
Disclaimer
The information and publications are not meant to be, and do not constitute, financial, investment, trading, or other types of advice or recommendations supplied or endorsed by TradingView. Read more in the Terms of Use.