I've not been posting much (welcome to adhd/autistic life), but if anyone ever drops me a message, I'm always still trading, so feel free to ask me any questions ever :)
So while much of the tariff movement was priced in with the recent drop from the top (1.38 range), we could (and have seen) an expected fall out, with today being the official tariff announcement/last day from Trump.
This afternoon we have NFP, unemployment rate and PMI.
Based on where we are from a TA standpoint, I imagine these to be positive for GBPUSD (least not much more downfall anytime soon/ much lower than where we bottomed out today).
I'm going to update this idea with further notes, but you can see what we're currently working with and get an idea based on the chart what I'm thinking.
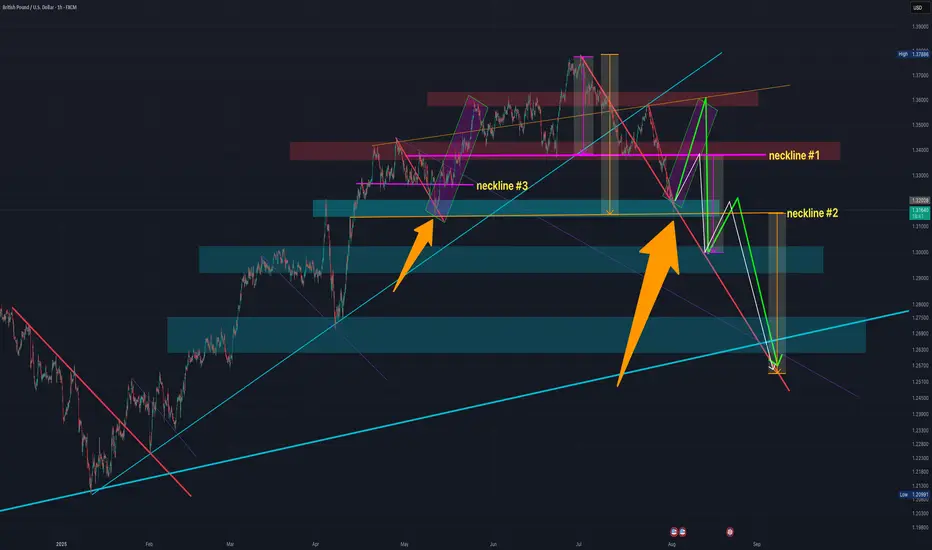
We've got the small H&S pattern at work (neckline #1), and a potentially bigger one at play (neckline #2), and then a previous one which I will discuss in the notes (neckline #3).
You can see across the chart a number of downward resistance lines (red).
I've shown them to express that we can see that every time we cross over the line, while it might bounce off it and then keep dipping further, it never crosses back under.
The only time it does cross back over is usually quite briefly (as per the orange arrows), but it's always short lived.
Case and point, we're not only very close to the current resistance-turned-support red line, but we're also hitting major support area.
This paired with such a big drop out (i.e. we could do with at least some short/mid term reversal) and the possibility of a retest of neckline #1, we've got plenty to work with.
You can see I've posted 2 arrows - one GREEN, the other WHITE.
I'll explain my thesis on that at some point and why I think it could easily cross back over the neckline before continuing to the downside.
We've also got the thin purple lines, which as you can see previously act as a resistance to where the reversal will happen at the lower end of the chart (which lines up with the major support line on the weekly chart, which I'll add to the notes at some point too.
Let me your thoughts.
I have a position open from today's drop to neckline #2, so let's see where it takes us :)
So while much of the tariff movement was priced in with the recent drop from the top (1.38 range), we could (and have seen) an expected fall out, with today being the official tariff announcement/last day from Trump.
This afternoon we have NFP, unemployment rate and PMI.
Based on where we are from a TA standpoint, I imagine these to be positive for GBPUSD (least not much more downfall anytime soon/ much lower than where we bottomed out today).
I'm going to update this idea with further notes, but you can see what we're currently working with and get an idea based on the chart what I'm thinking.
We've got the small H&S pattern at work (neckline #1), and a potentially bigger one at play (neckline #2), and then a previous one which I will discuss in the notes (neckline #3).
You can see across the chart a number of downward resistance lines (red).
I've shown them to express that we can see that every time we cross over the line, while it might bounce off it and then keep dipping further, it never crosses back under.
The only time it does cross back over is usually quite briefly (as per the orange arrows), but it's always short lived.
Case and point, we're not only very close to the current resistance-turned-support red line, but we're also hitting major support area.
This paired with such a big drop out (i.e. we could do with at least some short/mid term reversal) and the possibility of a retest of neckline #1, we've got plenty to work with.
You can see I've posted 2 arrows - one GREEN, the other WHITE.
I'll explain my thesis on that at some point and why I think it could easily cross back over the neckline before continuing to the downside.
We've also got the thin purple lines, which as you can see previously act as a resistance to where the reversal will happen at the lower end of the chart (which lines up with the major support line on the weekly chart, which I'll add to the notes at some point too.
Let me your thoughts.
I have a position open from today's drop to neckline #2, so let's see where it takes us :)
Trade active
LONG position open for the short/mid term to see where it takes us. Will keep the notes updated as much as possible over the coming trading days/weeks.
Note
I make mistakes in my posts all the time, so let me know if you spot any, but I meant to say: We've also got the thin purple lines, which as you can see previously act as a resistance, AND THEN LATER BECOME A SUPPORT* to where the reversal will happen at the lower end of the chart (which lines up with the major support line on the weekly chart, which I'll add to the notes at some point too**
Note
So I was a little confused on the neckline #3 H&S, and why it didn't quite conform to the usual: - Measure the distance from the top of the head to the neckline
- Project that same distance downward from the neckline breakout to estimate the target
I did some measuring, and 1, 2, and 3 are all exactly the same size.
So while not traditional in measuring the drop from the neckline, it did technically project the same distance as the top of the head to the neckline... it just did it from slightly above the neckline.
I did a little reading online, and found that is technically a valid H&S pattern (something I didn't know before, may be everyone else did).
Right now, we’ve got the same set up happening. A and B (so far) are the exact same size.
So based on the 1,2,3 idea, C looks like it could be C #1,
Assuming that neckline #2 is also a bigger H&S pattern forming, we would expect the right shoulder to peak in line with the left shoulder (as a rule of thumb at least).
This would bring us back above the neckline #1 (much like we see happen in the 1-2-3 H&S to the left of the chart.
This might NOT happen, which is why I've drawn in C #2 - but I wanted to highlight how GBPUSD can move, and the potential for a fake out above the neckline #1 could happen, and it could conclude higher up the chart than the traditional H&S calculation suggests.
Note
I also wanted to highlight that NONE of this might happen at all...if I zoom out on the chart, and compare the chart movement against wyckoff theory distribution example from another chart, we've actually only just reached AS point (orange arrow on example) which entirely means we're going up way above our 1.37 high.
I'm taking each situation as it comes, and if i end up holding longer, I will of course.
The sharp move to the upside is very inline with this being entirely possible too, but we shall see over the coming trading days how it pans out.
We've already got our hard bounce to the upside, which kind of knew was going to happen - as I said above, we were too close to the resistance-come-support, and with the volatility NFP + unemployment rate gives usually, it only had room to push up.
Disclaimer
The information and publications are not meant to be, and do not constitute, financial, investment, trading, or other types of advice or recommendations supplied or endorsed by TradingView. Read more in the Terms of Use.
Disclaimer
The information and publications are not meant to be, and do not constitute, financial, investment, trading, or other types of advice or recommendations supplied or endorsed by TradingView. Read more in the Terms of Use.