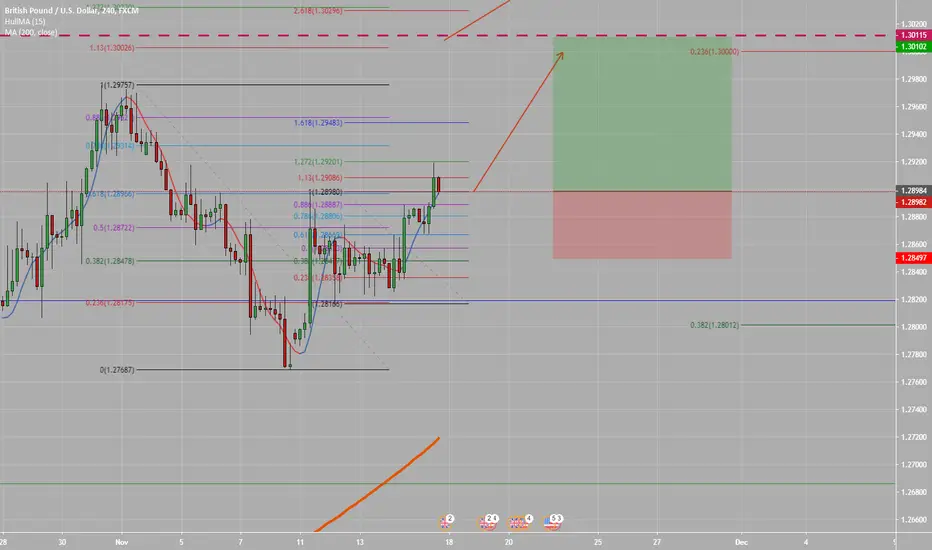
GBPUSD Short Term Long Opportunity
1. Both Monthly and Daily charts are turning bullish
2. On Weekly time frame 200SMA is within reach just above 1.3 level which can attract it
3. On Weekly time frame the Bat Pattern has not been completed yet and is possibly failing due to flag formation. If it fails, we will have ALT bat above 1.3 price level
Trade active
Note
a second entry chance is possible for a rally upwards. Daily bollinger bands are squeezed so a breakout is imminent: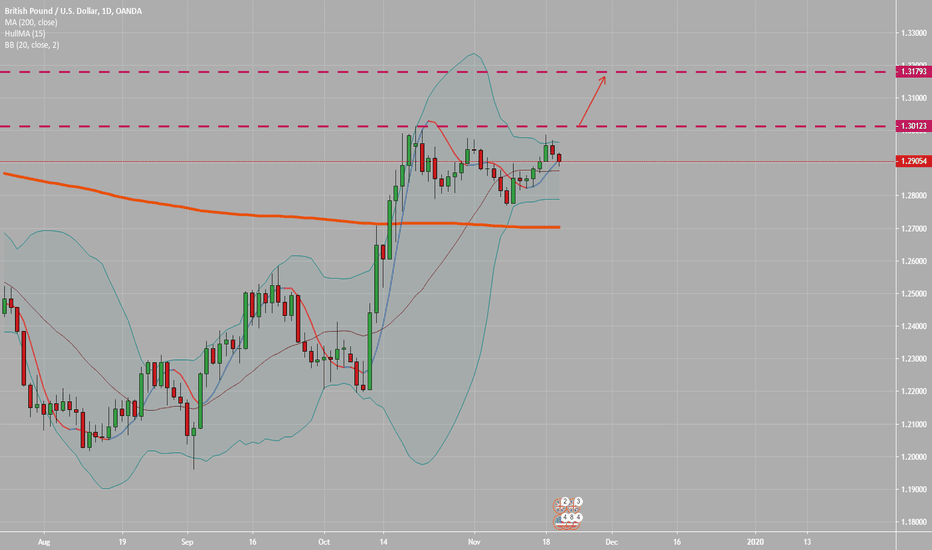
🔵 Free Telegram Channel: t.me/VikinsaFx
🔴 Training: bit.ly/vikinsacorestrategyprogram
🟣 YouTube : youtube.com/vikinsa
🟡 Twitter: twitter.com/vikinsa
🔴 Reviews: bit.ly/VikinsaTrustPilotViews
🔴 Training: bit.ly/vikinsacorestrategyprogram
🟣 YouTube : youtube.com/vikinsa
🟡 Twitter: twitter.com/vikinsa
🔴 Reviews: bit.ly/VikinsaTrustPilotViews
Related publications
Disclaimer
The information and publications are not meant to be, and do not constitute, financial, investment, trading, or other types of advice or recommendations supplied or endorsed by TradingView. Read more in the Terms of Use.